Remote RStudio configuration (keep forgetting options and ports).
ssh -o "ExitOnForwardFailure yes" -f -N -L 1234:localhost:8787 oneInitialize runs for sensitivity, looping over parameters and data. See:
- sensitivity.md (Myers)
- sensitivity-allen.md
Overall:
ggplot(yields_dat) + geom_density(aes(value)) 
Compare over 12 simulation configurations with different parameters and different training data, the GP does consistently well. Only one case has relatively poor outcomes.
ggplot(yields_dat) + geom_density(aes(value, color=as.factor(simulation), fill=as.factor(simulation)), alpha=.5)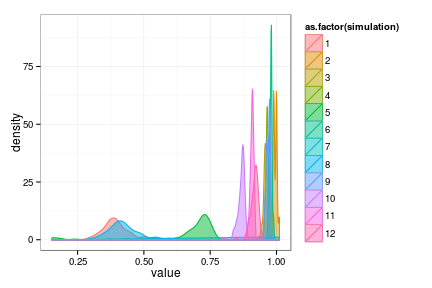
- Run data backup to local disk
- NSF expense accounting
- calendar updates
- software paper policies email
- Luke Arbor reply
- looking at quick way to check out solutions to sums of Fisher wave equation over different diffusion coefficients (heterogenous dispersal rates), e.g. in C
- Reply to Alex about wave + diffusion type solution pattern.
f1 <- function(t, y = 4, r = 2, s = 1) (r * dnorm(y, 0, 2 * r * sqrt(t)) + s *
    dnorm(y, 0, 2 * s * sqrt(t)))/(dnorm(y, 0, 2 * r * sqrt(t)) + dnorm(y, 0,
    2 * s * sqrt(t)))
curve(f1, 0.01, 8, xlab = "time", ylab = "mean dispersal")