Modeling choices
Allee effect model: Myers Beverton-Holt with harvesting-effort mortality:
\[ x_{t+1} = f(x) = \frac{a x_t^{\alpha}}{1+ x_t^{\alpha}/b} - e x \] For $ = 2 $, equilibrium points are $ x = 0 $ and
\[ x = \frac{ab}{2(1+e)} \pm \frac{1}{2} \sqrt{ \left(\frac{ab}{1+e}\right)^2-4b } \]
As written this differs from our earlier solutions a couple respects – the growth function applies to the unharvested population, which then experiences harvesting mortality, and the control variable is fishing effort, not harvest.
We have a bifurcation point induced by increasing effort when \[ \left(\frac{ab}{1+e}\right)^2-4b = 0 \] \[ e^* = \frac{a\sqrt{b}-2}{2} \]
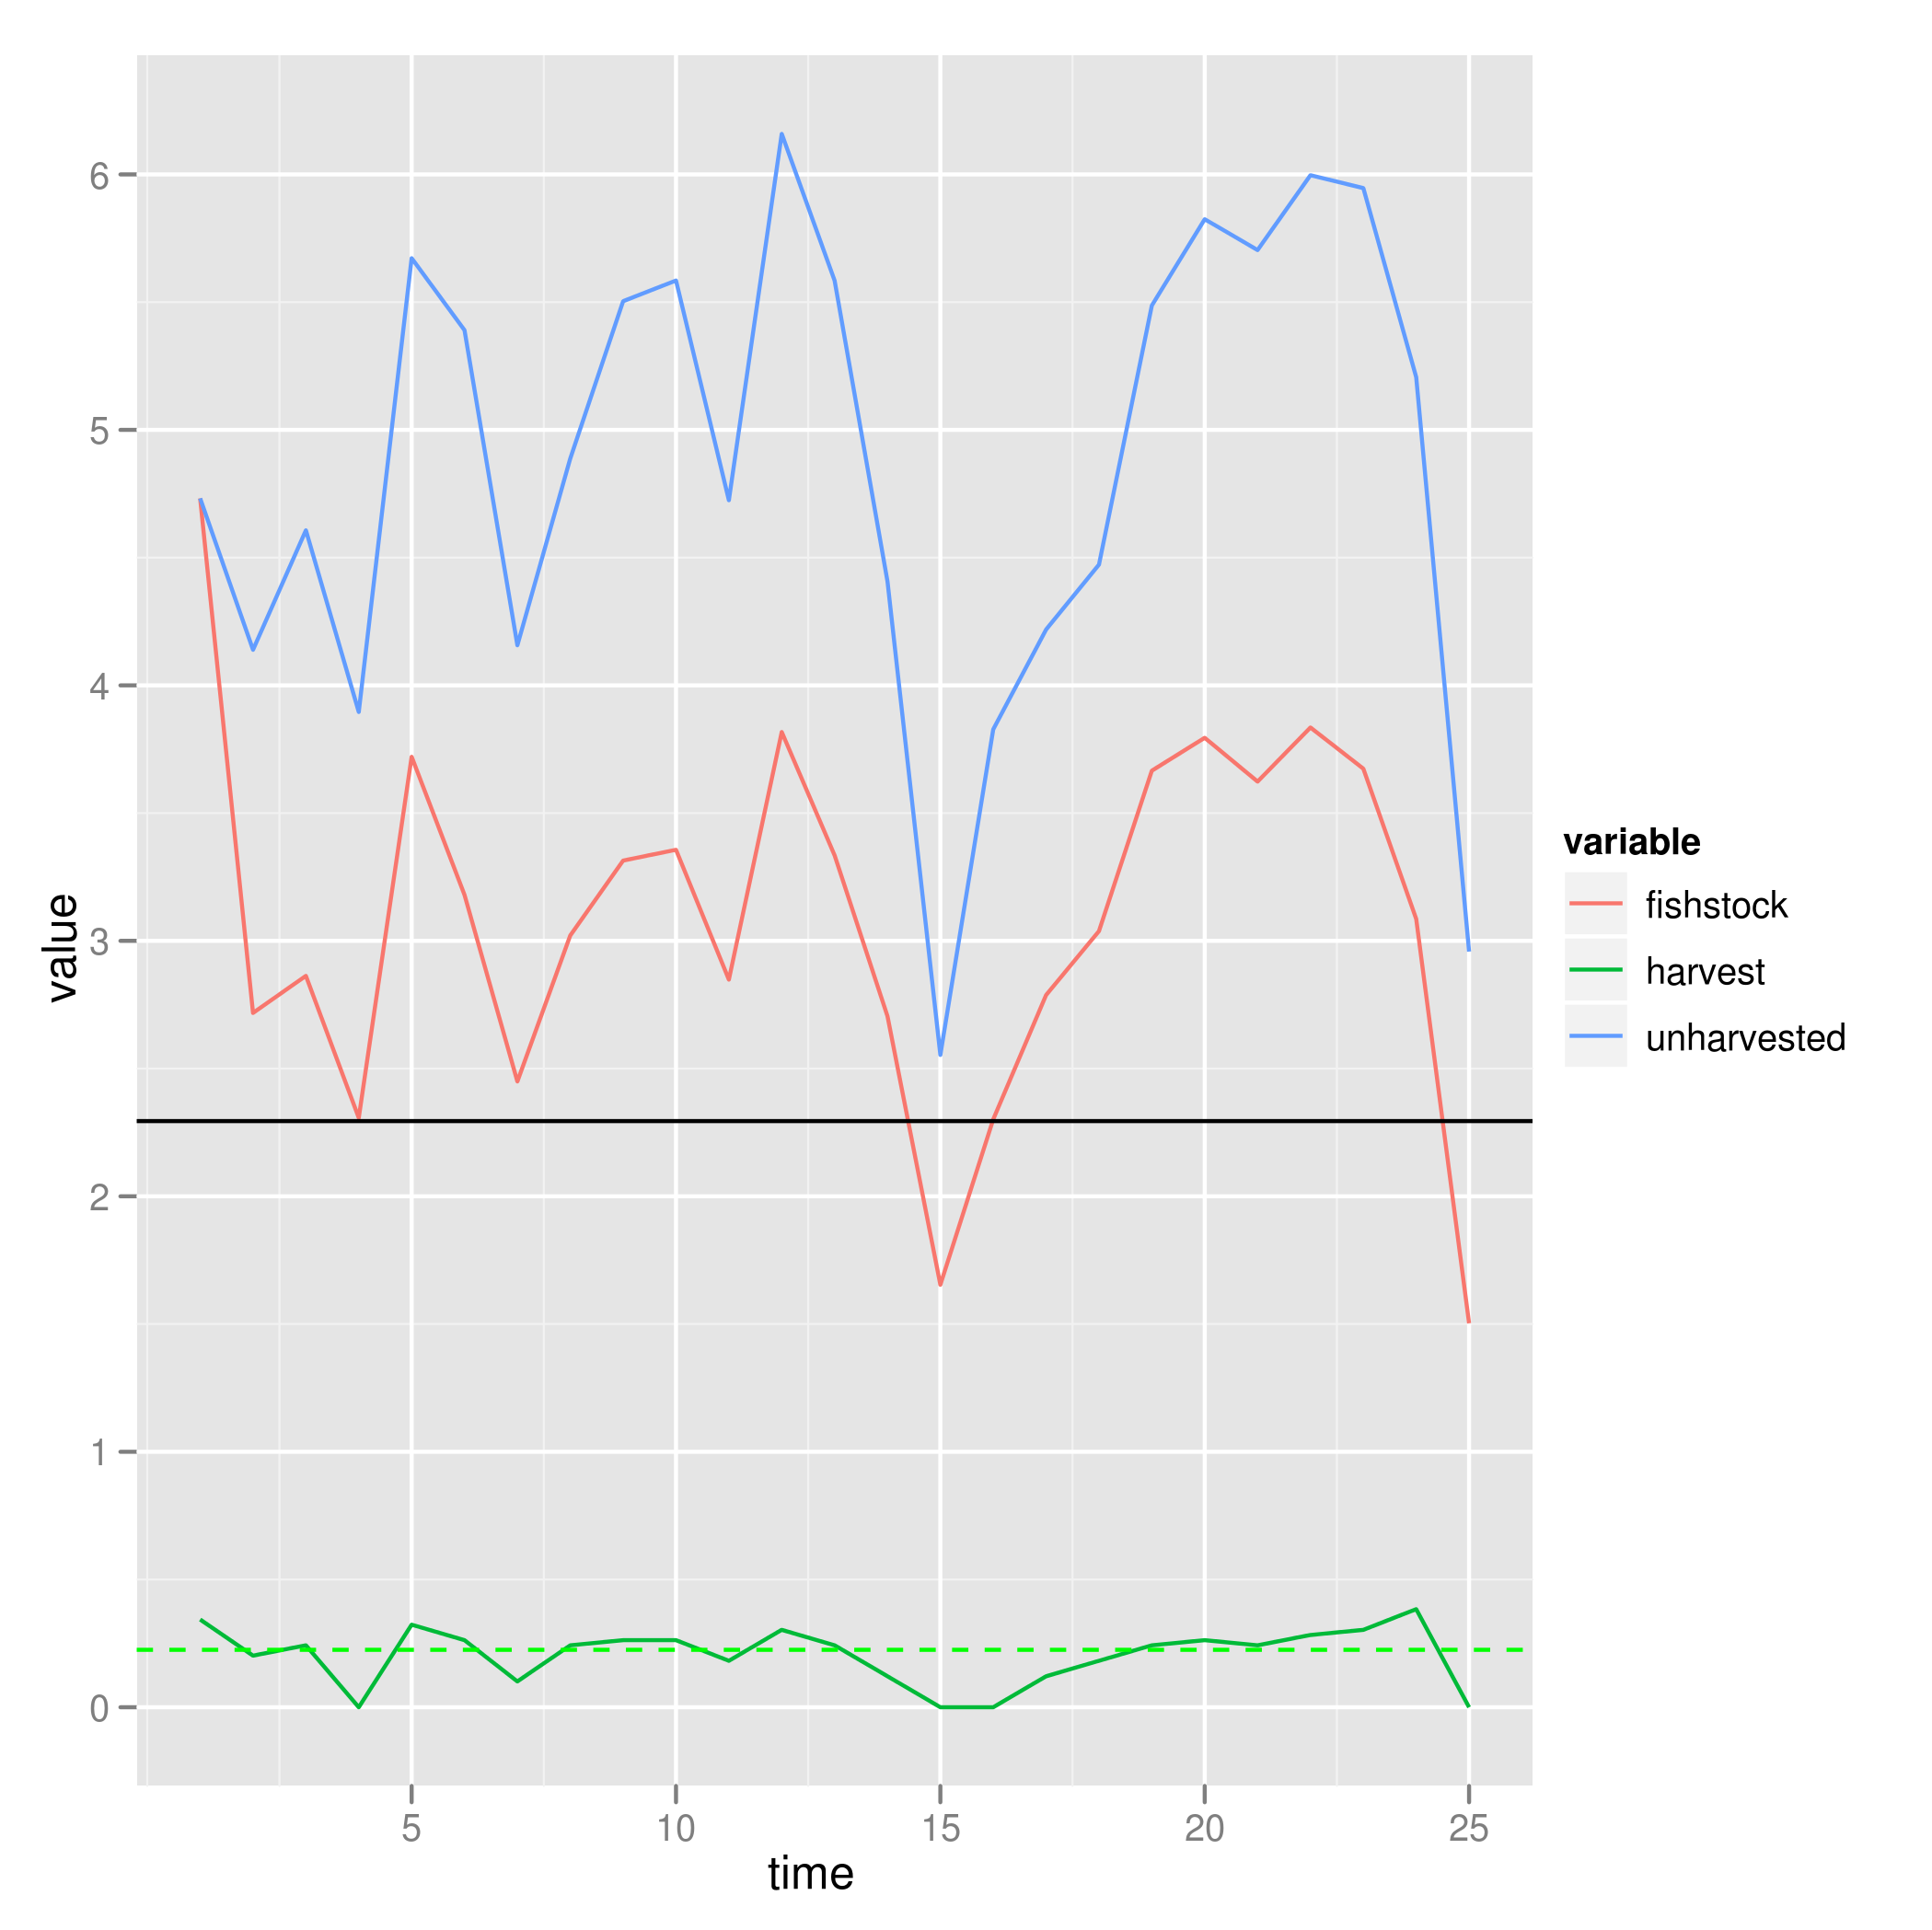
Implementing this (see earlier notes for implementation) in stochastic optimal control, we see that we now harvest continuously, not just when population exceeds Reed’s S escapement level (black line, defined in this context as the highest value of the population size at which we do not harvest). More to the point, note that we often but not always apply an effort (green path) that exceeds $ e^* $, (dotted green line).
Despite this, crashes are not that common. We observe 18/100 populations that crash:
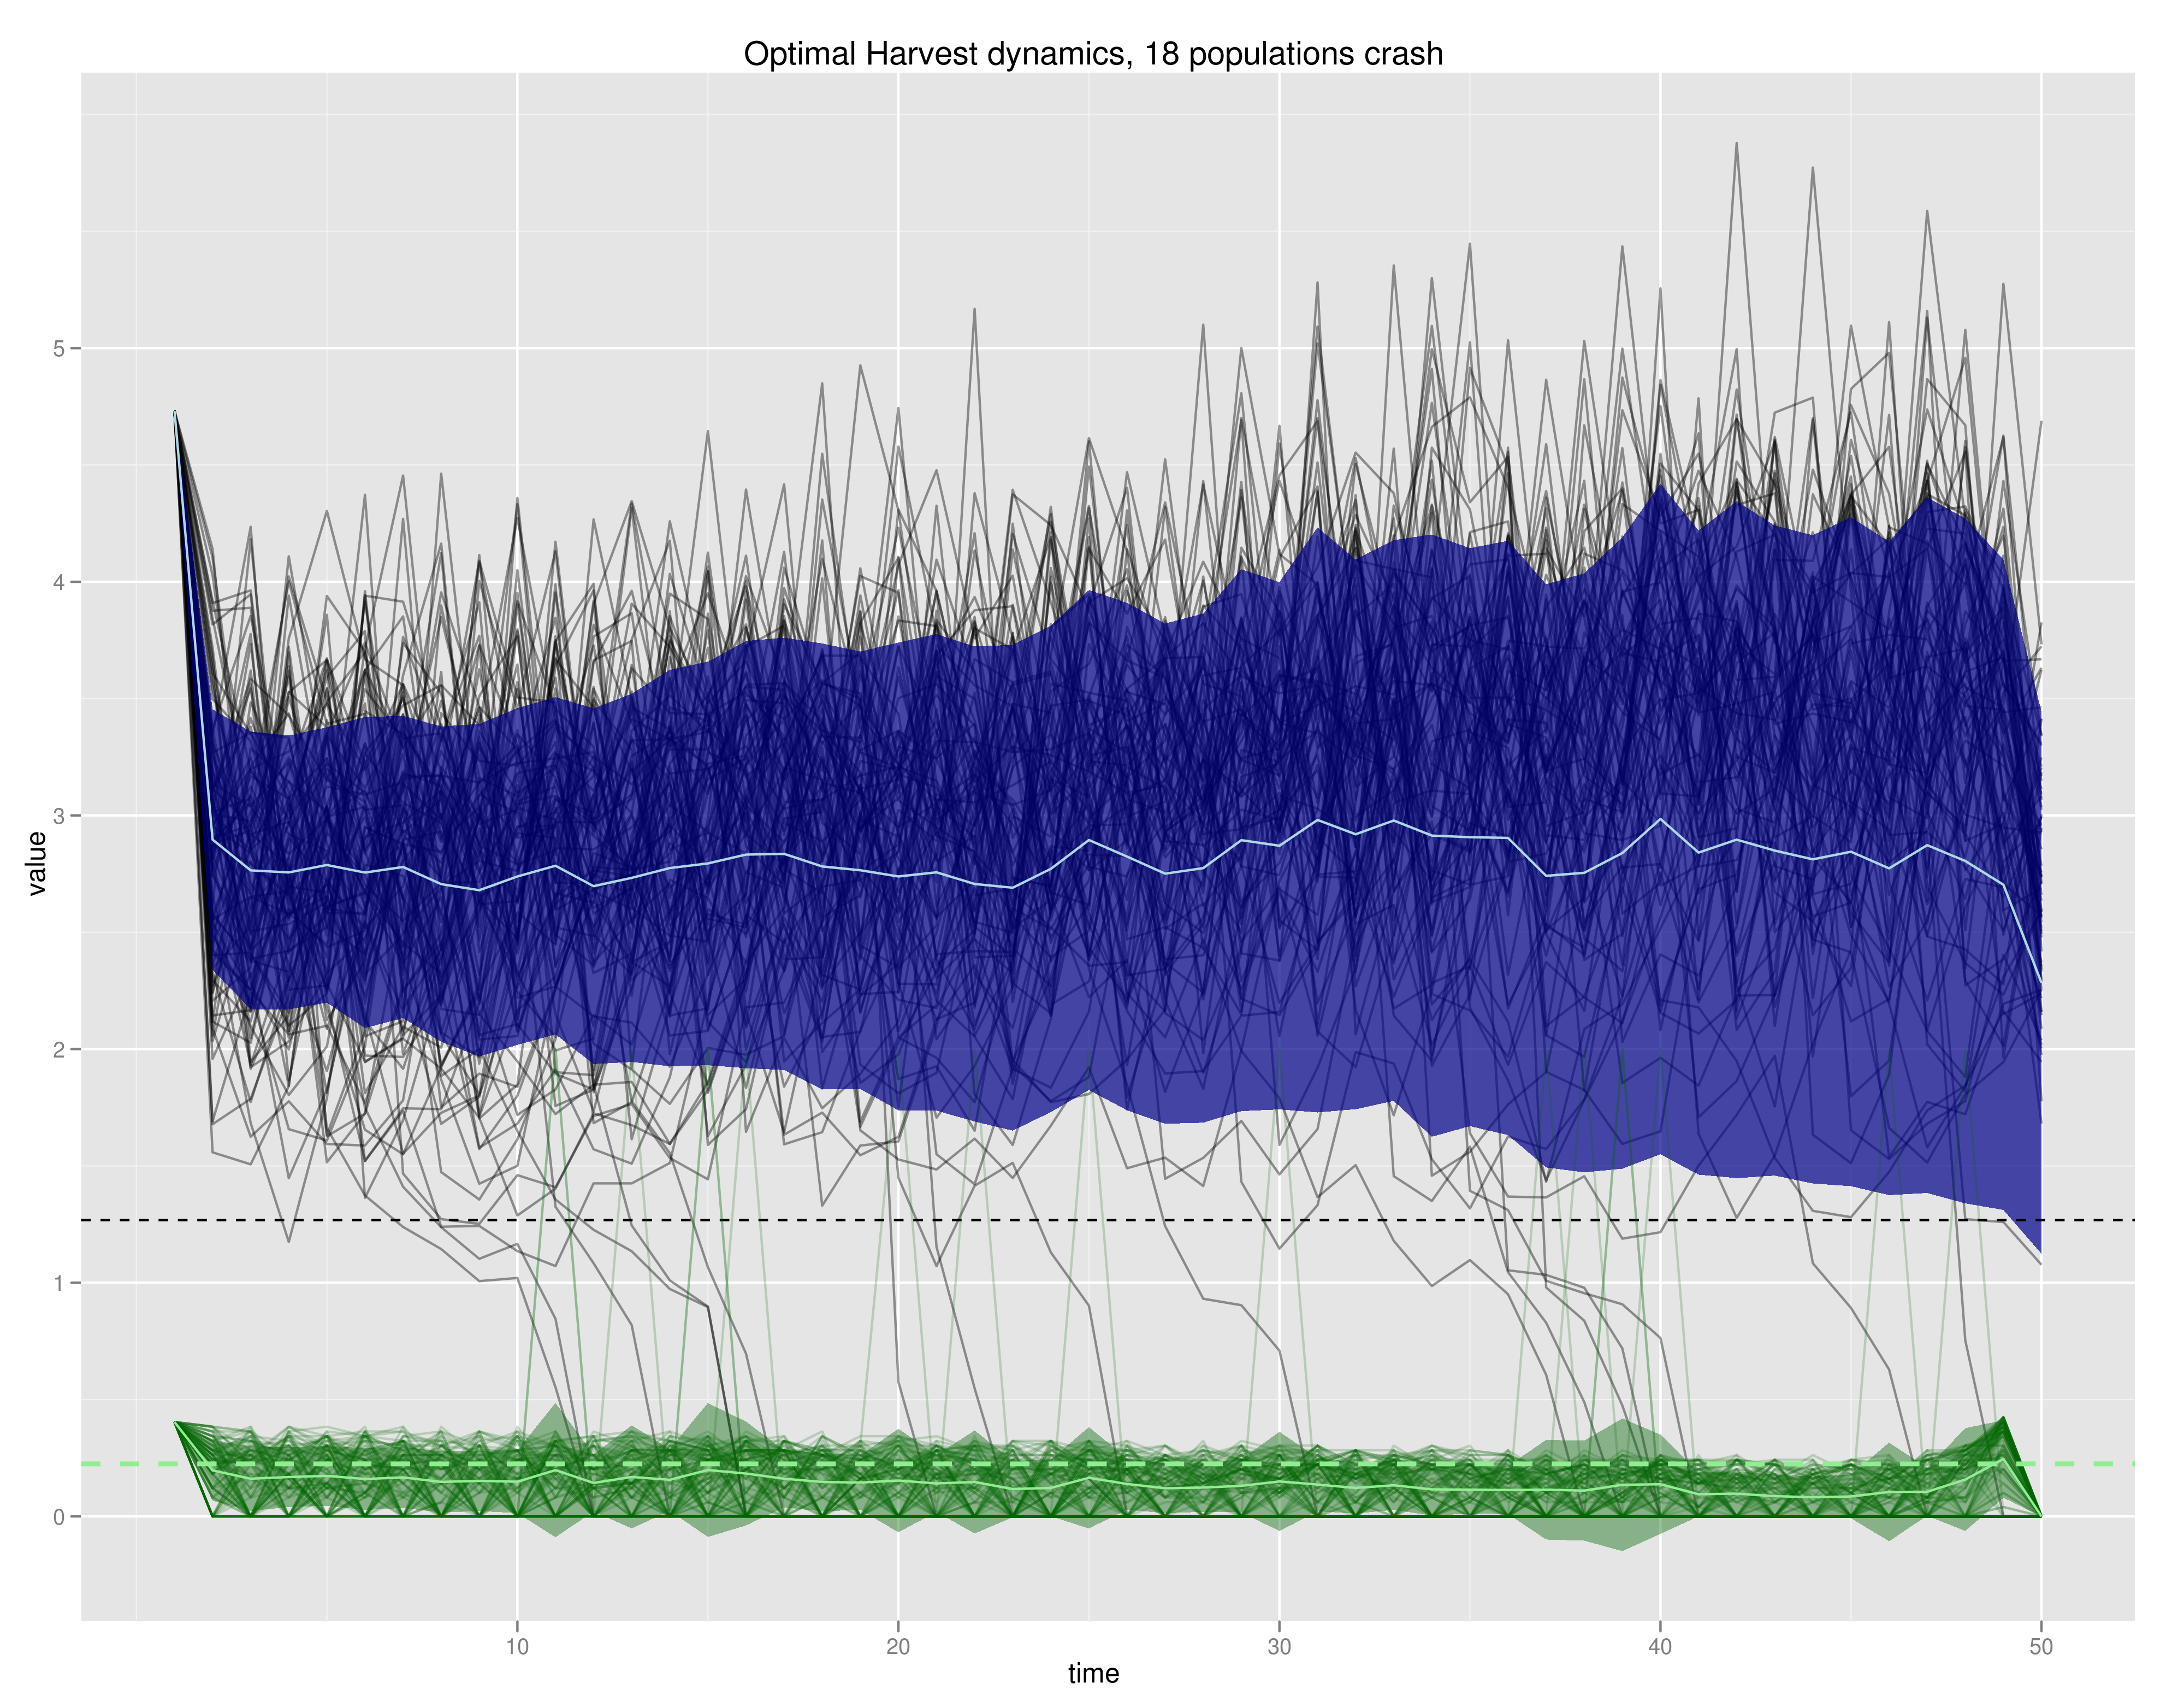
The population dynamics under optimal harvesting for the 100 replicates are shown as black lines, with the overall average trend (light blue line) and standard deviation (blue ribbon) overlaid. A few population crashes can be seen. The black dotted line indicates the allee threshold - note that we see a few populations that are stochastically rescued from below this threshold.
The green lines shows the harvesting effort (mean and sd shown in the ribbon as before). Note the occasional spikes in harvest effort matching populations that dip below the (unharvested) Allee threshold - with the current profit/cost model it’s worth fishing these out as fast as possible.
The most interesting observation is the dashed green line – the tipping point at which effort destroys the stable point. Harvesting at that level, the only stable point in the system is extinction - but because it is the control variable, it can simply be relaxed next year, allowing the population to recover (as long as the current population isn’t below the allee threshold). Note that on average the effort stays below this level.
Data sources
Humboldt (Peruvian) Anchoveta
some references for fisheries collapse
Dynamics of collapse (Mullon et. al. 2005)
Unexpected collapse (Pinsky et. al. 2011)
Collapses: stock assessment vs catch (BRANCH et. al. 2011) (uses the NOAA data above)
Extinction vulnerability (Dulvy et. al. 2003)
Extinction vulnerability in Coral reef fishes (Graham et. al. 2011)
pdg-control updates
update sent to Michael
List of some next steps for pdg-control Training problem II on the github Issues tracker.
References
Mullon C, Freon P and Cury P (2005). “The Dynamics of Collapse in World Fisheries.” Fish And Fisheries, 6. ISSN 1467-2960, https://dx.doi.org/10.1111/j.1467-2979.2005.00181.x.
Pinsky M, Jensen O, Ricard D and Palumbi S (2011). “Unexpected Patterns of Fisheries Collapse in The World’S Oceans.” Proceedings of The National Academy of Sciences, 108. ISSN 0027-8424, https://dx.doi.org/10.1073/pnas.1015313108.
BRANCH T, JENSEN O, RICARD D, YE Y and HILBORN R (2011). “Contrasting Global Trends in Marine Fishery Status Obtained From Catches And From Stock Assessments.” Conservation Biology, 25. https://dx.doi.org/10.1111/j.1523-1739.2011.01687.x.
Dulvy N, Sadovy Y and Reynolds J (2003). “Extinction Vulnerability in Marine Populations.” Fish And Fisheries, 4. ISSN 1467-2960, https://dx.doi.org/10.1046/j.1467-2979.2003.00105.x.
Graham N, Chabanet P, Evans R, Jennings S, Letourneur Y, Aaron MacNeil M, McClanahan T, Öhman M, Polunin N and Wilson S (2011). “Extinction Vulnerability of Coral Reef Fishes.” Ecology Letters, 14. https://dx.doi.org/10.1111/j.1461-0248.2011.01592.x.