Wednesday: Data wrangling into graphs

Really high sampling runs (20000 pts) still don’t seem to show any improvement in deut3 dataset summary statistics, perhaps it is the window size. testing by launching deut_replot.R, n5 on zero, 500, 1000, 2000 on a fixed windowsize of 60, see how it compares to the half window. probably because is such a weak signal.

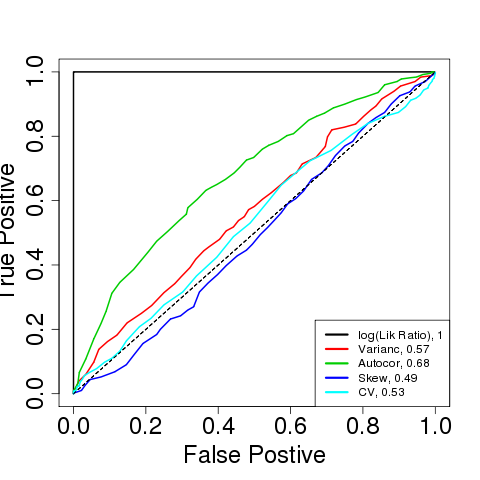
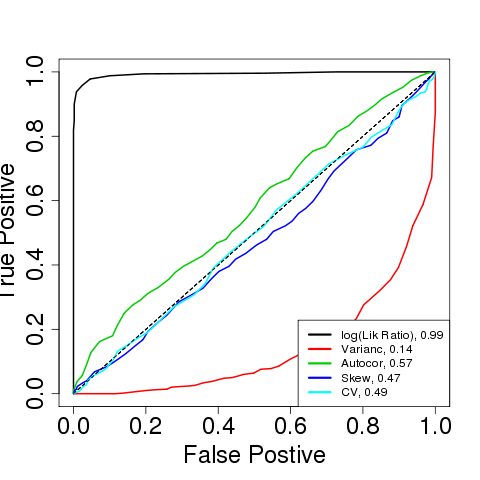
running drake tau sampling with corrected (1/2 length) windowsizes. – destroys any improvement in indicators:

1/2 windows
1/2 windows
attempt to fix at size 8 windows that fails to get the right window do to a bug (wasn’t passed down from bootstrap_tau, just found and fixed).
always size-8 windows performs better.
Now show tiny improvement by using smaller window (20) on the 500 timeseries for deut3,
and using the smaller window (8) on the 500 timeseries for drake:

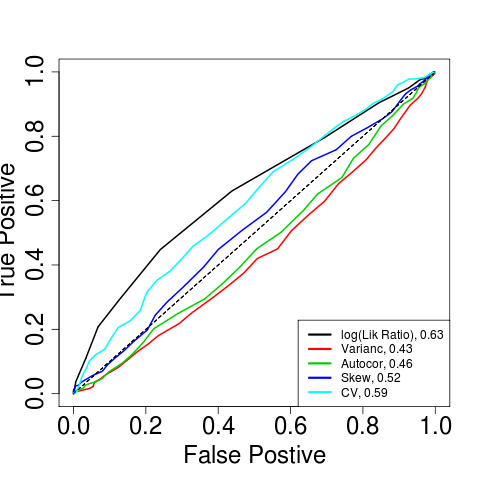
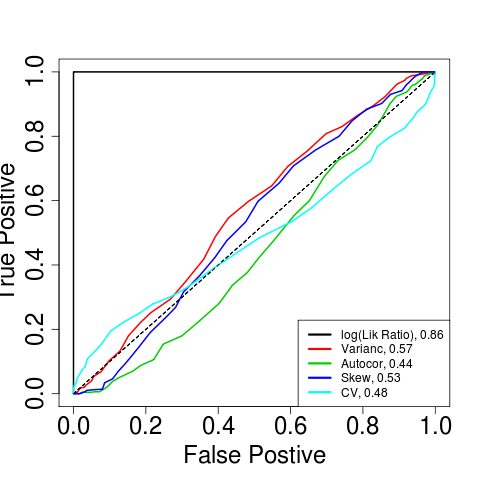
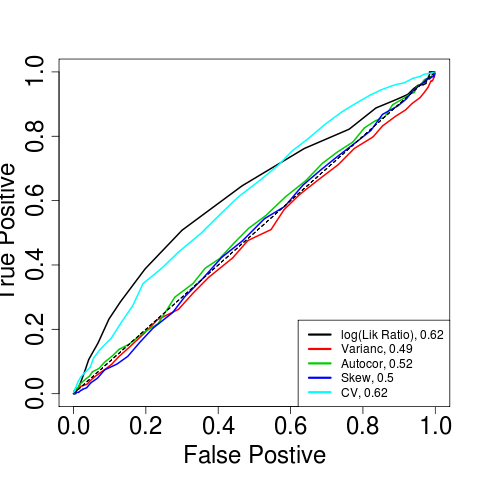
Exploring the impact of windowsize on deut3 data now (5, 10, 25, 50 size on 500 pts, see code):

check machine status live. For completed outputs from yesterday: running corrected windowing, and uploading from farm:

Daphnia H6 with LTC done running on c0-8
deut1 done running on c0-6
caco3 on c0-2 done:
caco3 on c0-2 done:
  • Daphnia I9 with LTC still running on C0-23
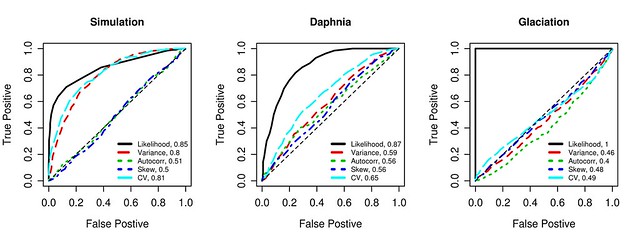
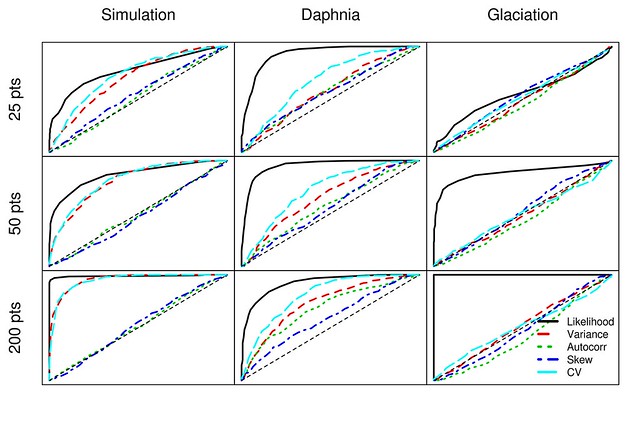
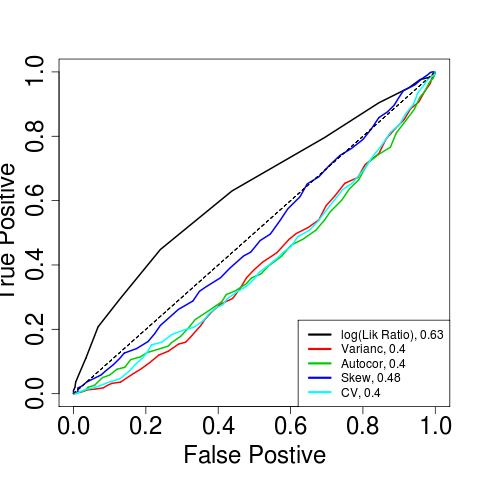
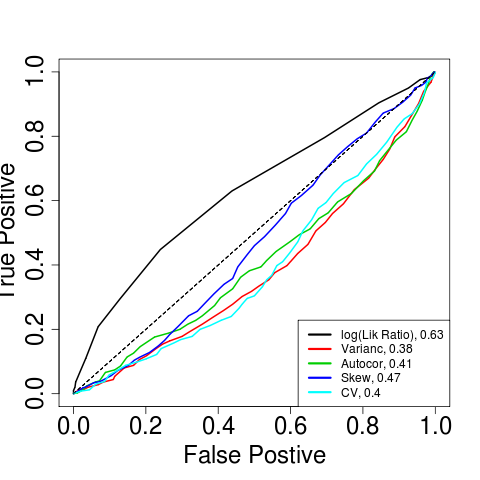
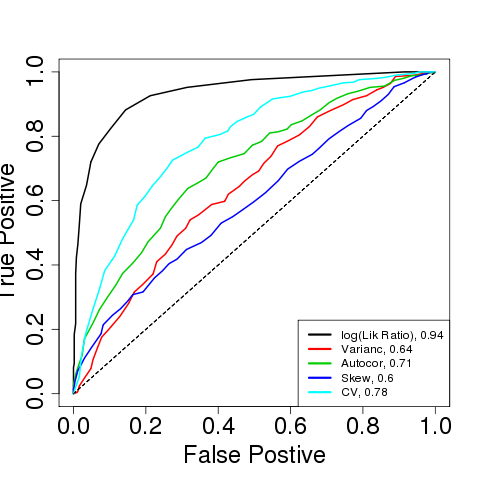
  • Writing code to assemble manuscript figures. Preliminary Figures 3 & 4 finally done. Probably need to add stable system still.
Figure 3
Figure 3
Figure 4
Figure 4