Alan meeting
Figure 1: Introducing the ROC Curve
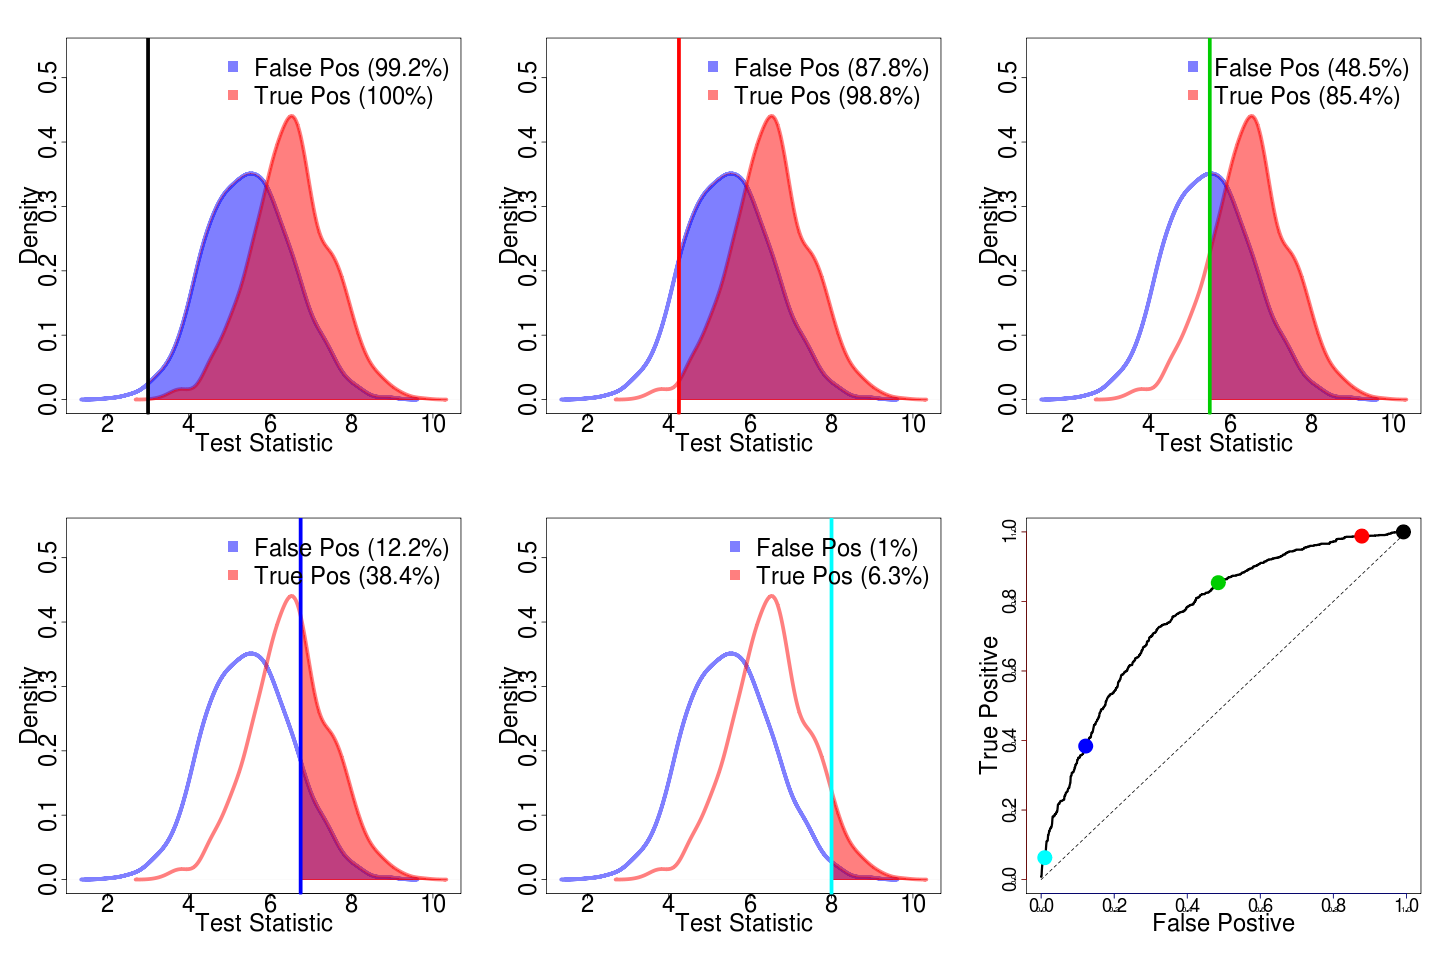
Figure 2: Standard approach
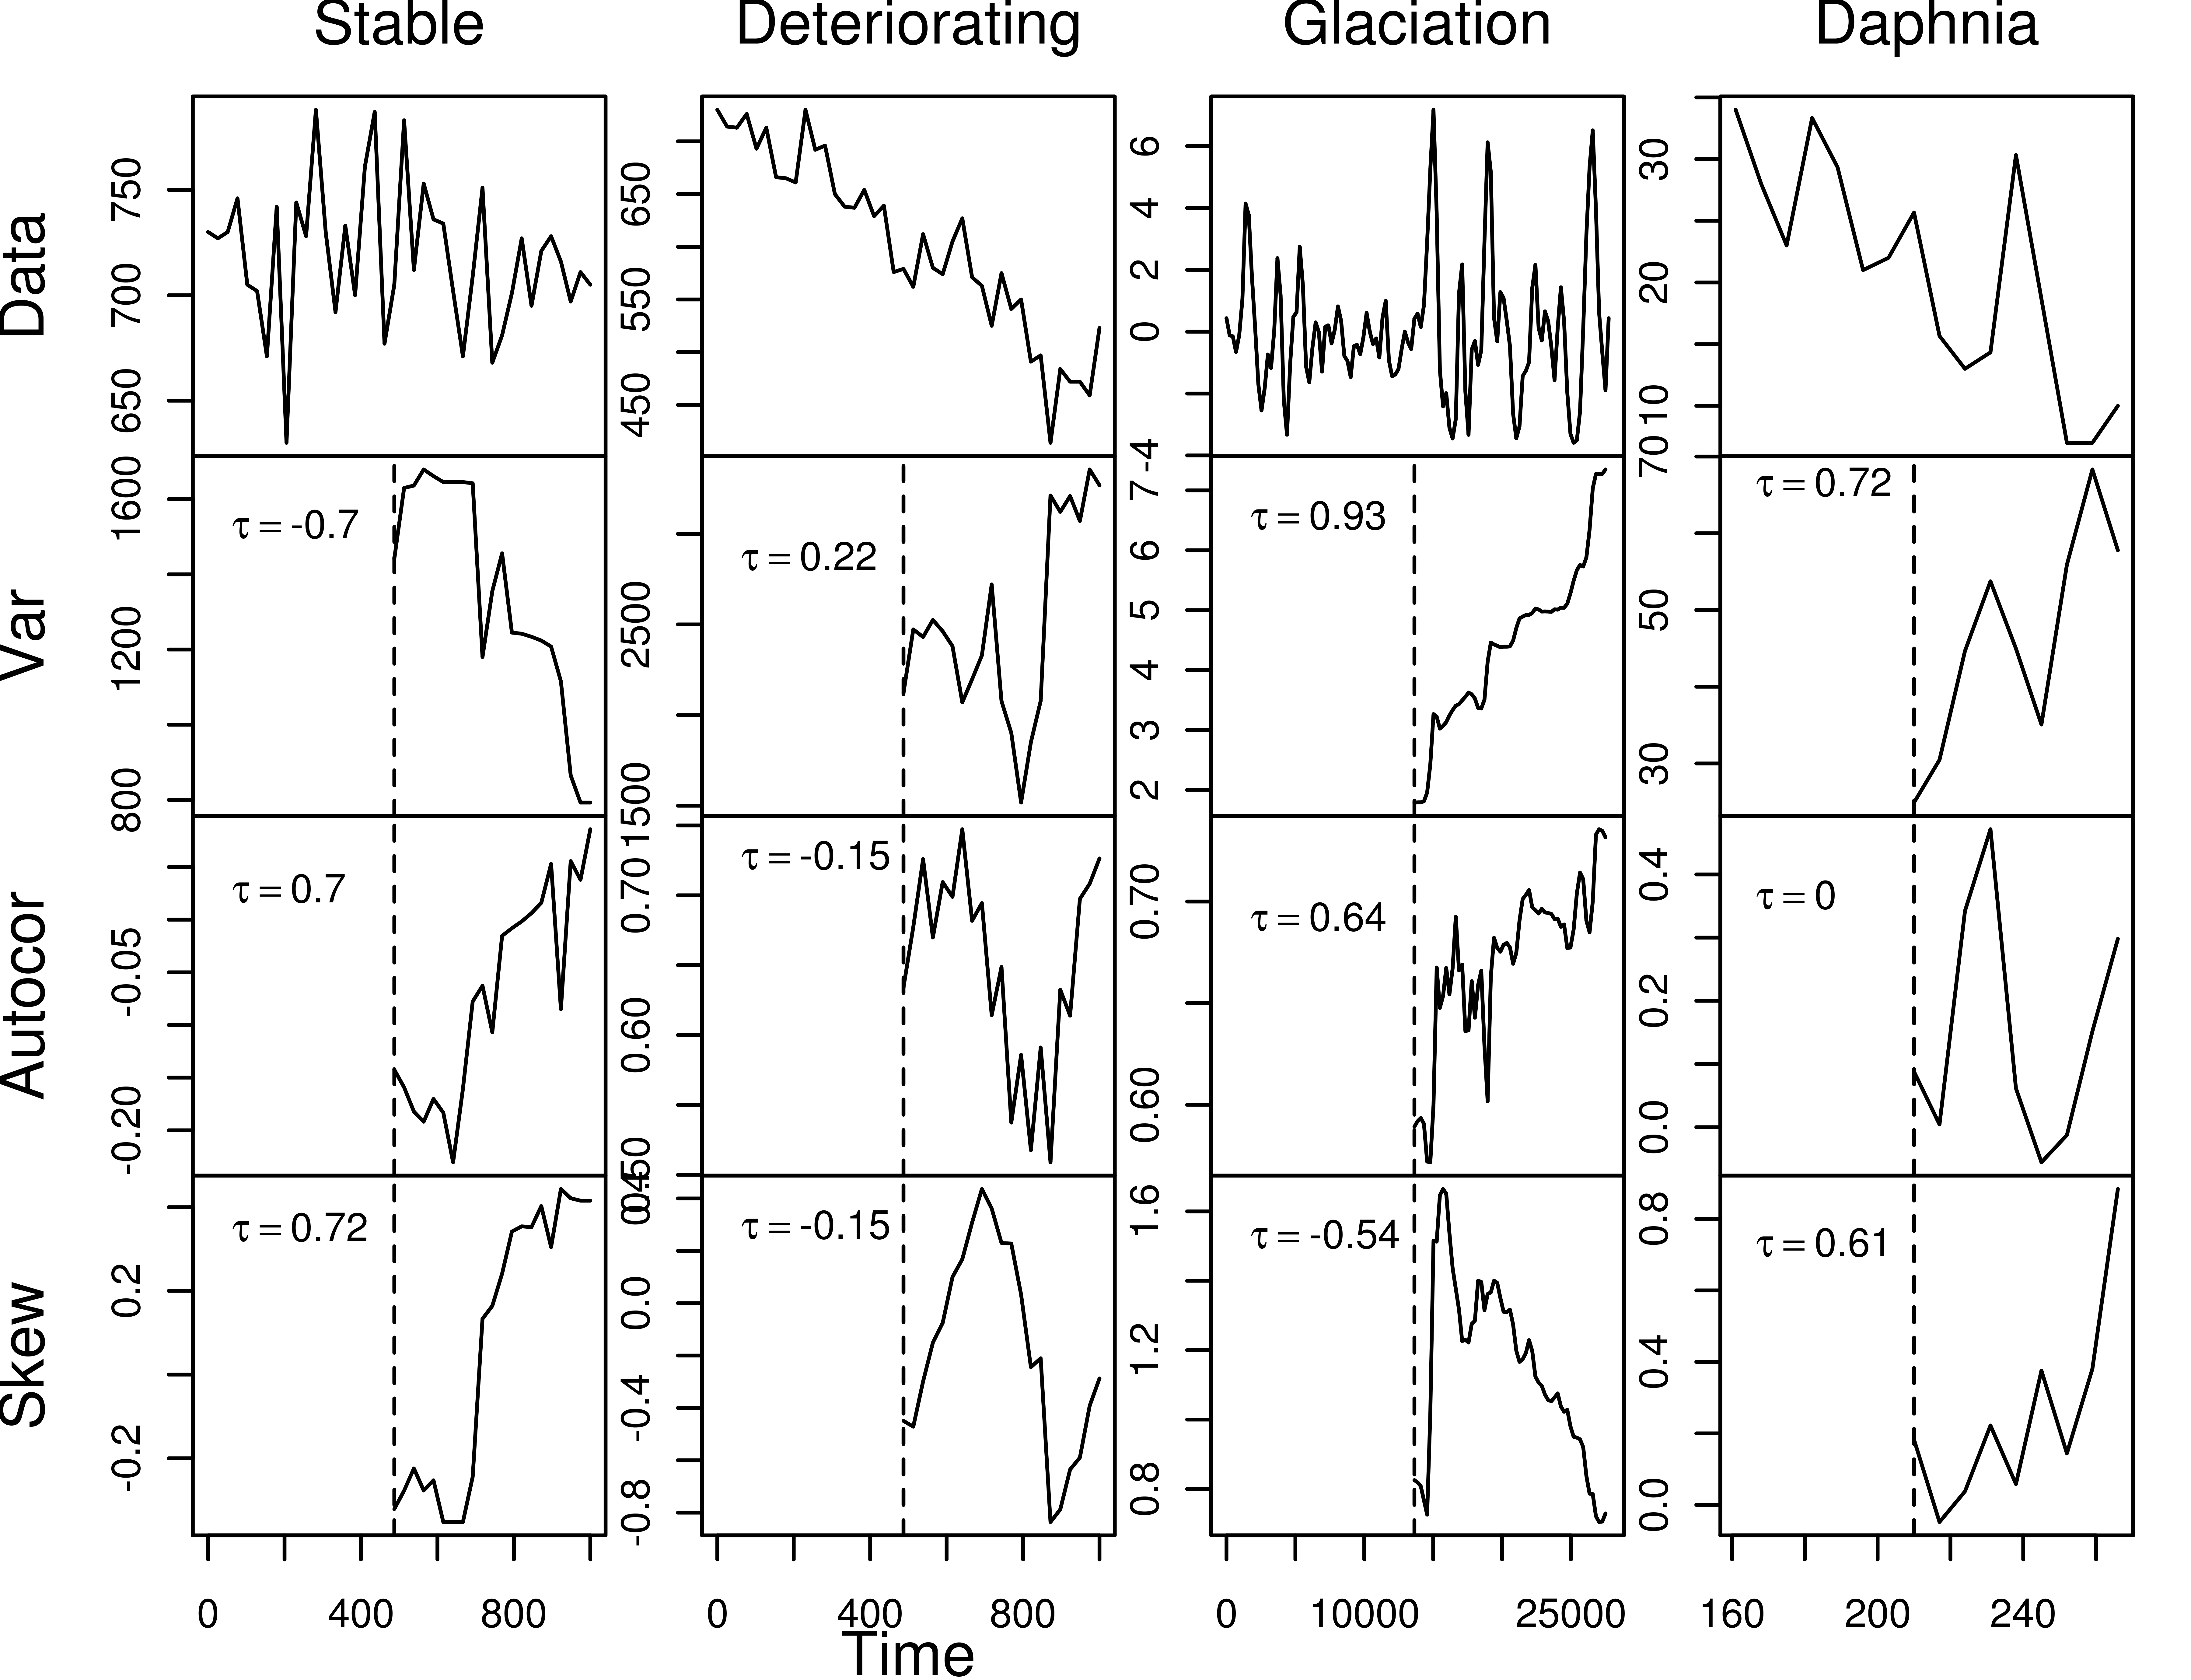
Figure 3: ROC curves corresponding to standard approach
Do we show the distributions? – Create for each, but log in appendix
ROC curves corresponding to increased sampling – our method, other stats? organize how?
Computational Runs
Running at constant sample points rather than sample effort.
- On eleven: n5ibm_stable.R 6pm
- On zero, n10 drake_analysis.R 6pm
- On zero, n19 deut_analysis.R 6pm (deut 3)
- on one, n19 deut_analysis.R 6:10pm (deut 1)
Segue: Amazon cloud through a local R session
Rather computationally limited at the moment. Tried Segue but don’t seem to be able to run custom functions:
[gist id=1059002]
On to plan B: requesting time on the caes cluster