Assembled plots for figures 1,2,3 see paper_plots.R. Considerable adjustment of axes/layout. Sent figures out for comments.
Considered removing skew/kurtosis from Figure 1 &/or Figure 2, currently leaving in (particularly in Figure 2 to make point clear that no indicator works well?) Easy to remove using paper_plots.R script.
To Do list:
Figure 3 layout should mimic Figure 2 as much as possible (font sizes, margins, etc).
Consider an arrow along the x-axis rather than dotted line for observed value.
Distribution color legend
Rewrite captions
Figure 2 y-axis labels shouldn’t appear as “Variance” “Skew” but be clear these are probability densities
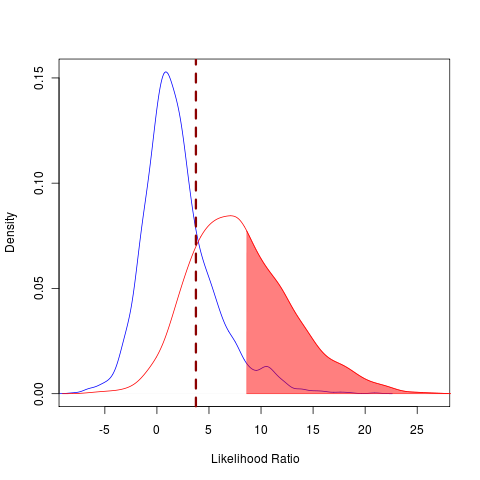
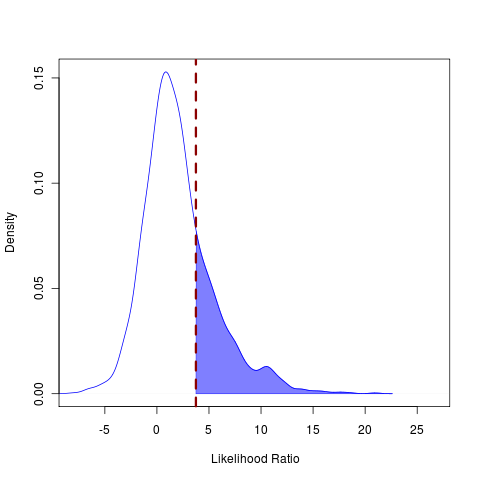
Figures to explain Type I and Type II error, like these: