Today working mostly on selecting examples of data sets to include in the figure patterns. Working with the idea of three figures – data, bootstraps of Tau, bootstraps of likelihood – in panels for several examples: some real data sets and some simulated data sets with and without warning. In addition to this, I still have some more work to do with references, and refining the writing of a few of the appendices.
Empirical example data, original signals
Code: Run real_data_examples.R to reproduce this set.
Deuterium Data, pre-processed
Deuterium data during Glaciation III shows the clearest signal, though also possibly Glaciation I. (order below is II, I, III, IV, click to enlarge for labels).
[flickr-gallery mode=“search” tags=“stochpop, processed” tag_mode=“all” min_upload_date=“2011-03-22 12:00:00” max_upload_date=“2011-03-22 12:05:00”]
Deuterium Data, unprocessed
Almost none of the unprocessed data shows a signal. Uneven spacing matters for autocorrelation and skew estimates, but not variance. [flickr-gallery mode=“search” tags=“stochpop, deut, raw” tag_mode=“all” min_upload_date=“2011-03-22 12:00:00” max_upload_date=“2011-03-22 12:05:00”]
CaCO3 Data
[flickr-gallery mode=“search” tags=“stochpop, CaCO3” tag_mode=“all” min_upload_date=“2011-03-22 12:00:00” max_upload_date=“2011-03-22 12:05:00”]
Simulated Data
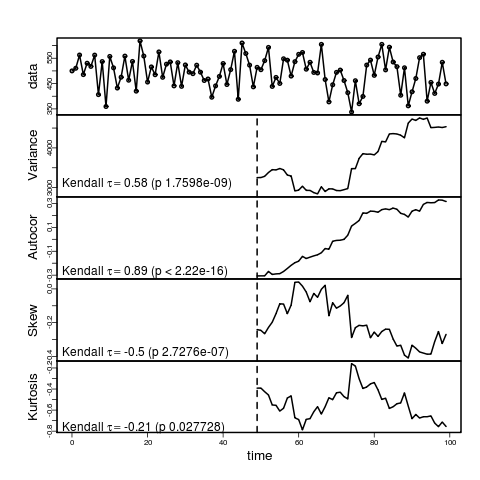
Uncertainty
Using code functions from bootstrap_indicators.R, run from script indicator_example.R. Note, these use the LTC model estimates. (easily confirmed – load the data by id, call timedep$setmodel)
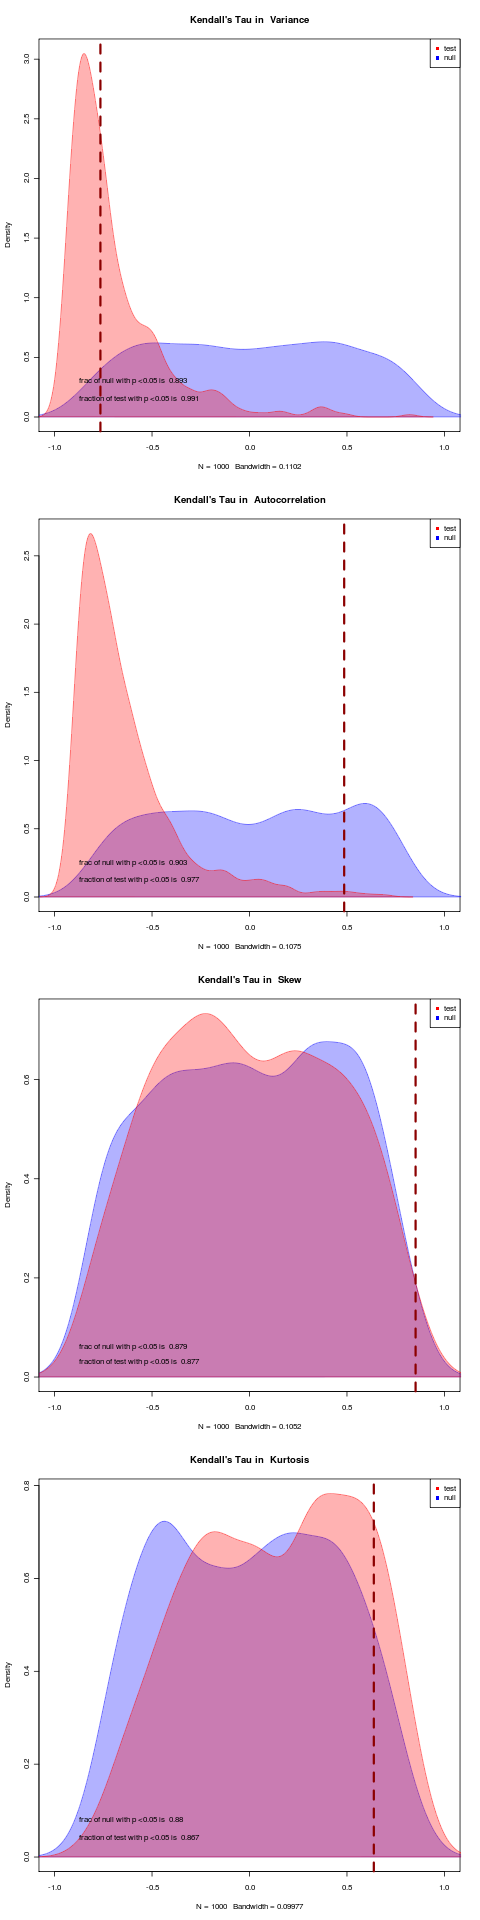
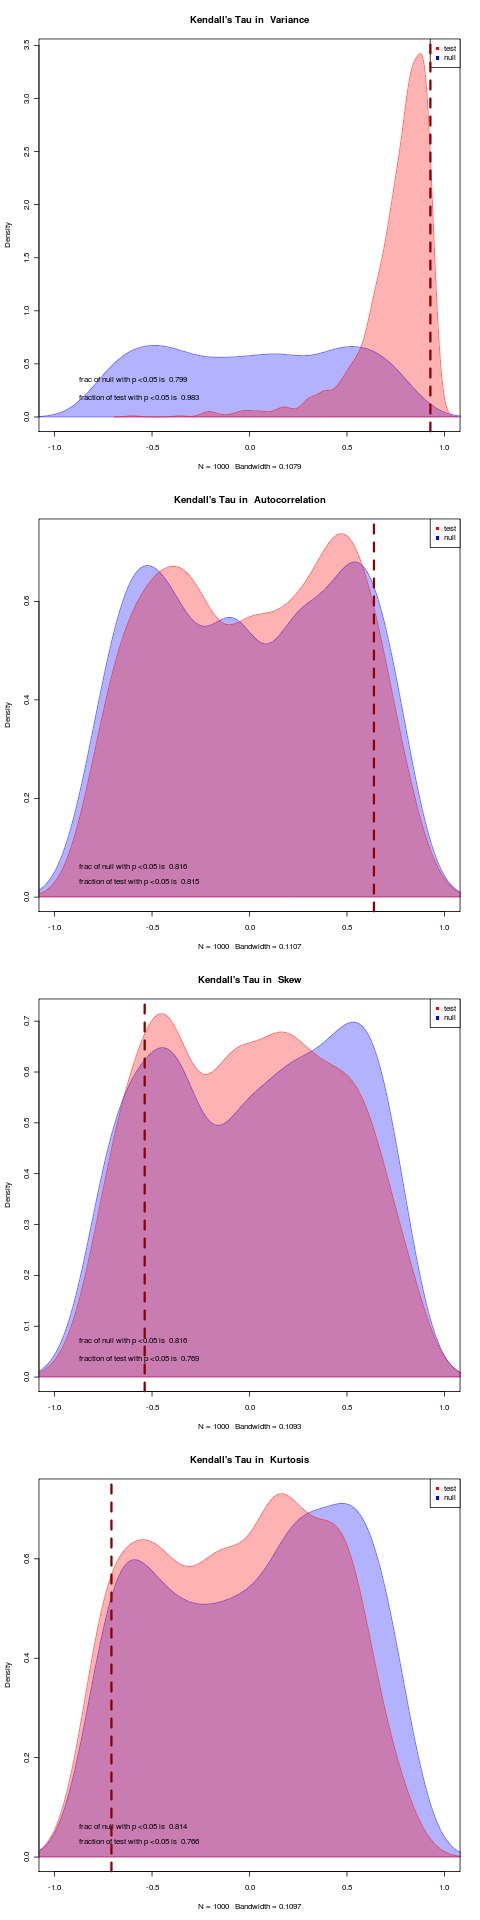
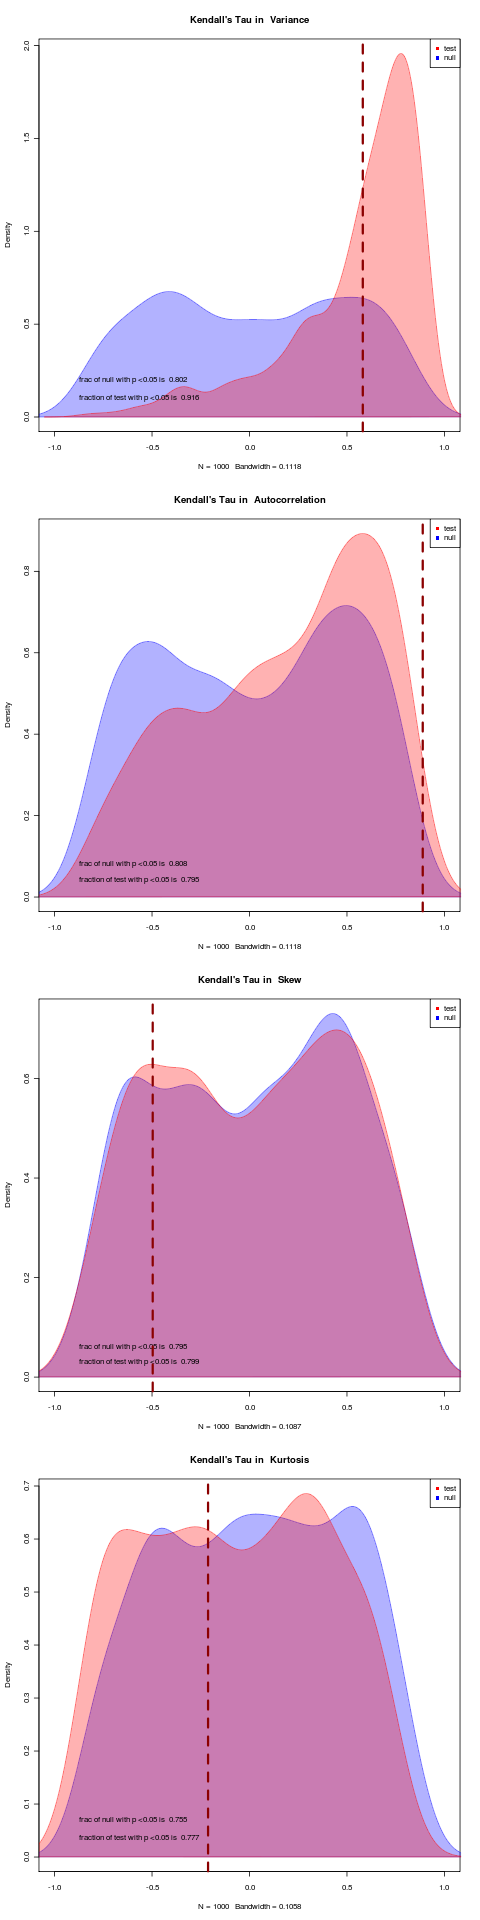
Columns are: CaCO3 Data, Deuterium Data, (Glaciation III) pre-processed, simulated data with crash. Rows are Variance, Autocorrelation, Skew, Kurtosis. Note that the higher moments are meaningless, containing virtually no signal, while variance is the most reliable.
Decreasing the uncertainty using likelihood
CaCO3 Data
using LTC against the null: 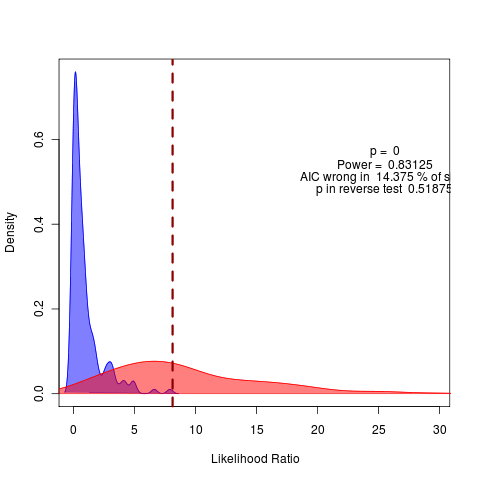
Deuterium Data, (Glaciation III) pre-processed
This I believe is fit with LTC 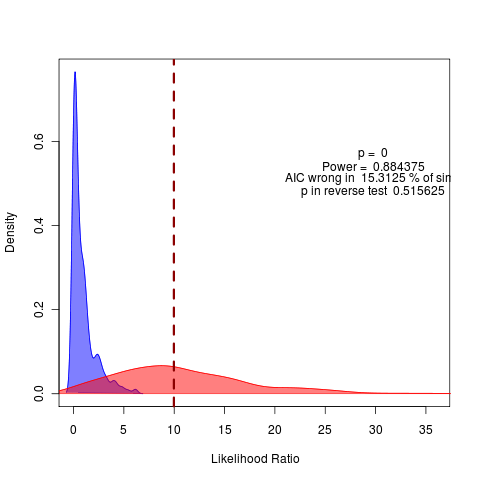
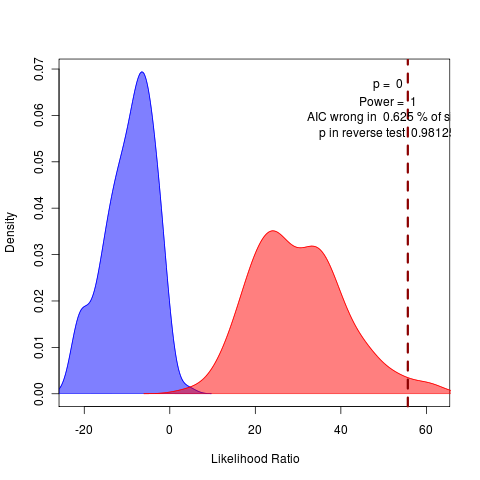
Model Choice for bifurcation type
Can consider choosing between LSN and LTC first on real data. Both the Glaciation III and CaCO3 dataset clearly prefer the saddle-node model, (though note that the CaCO3 data is increasing stability!). Code in model_choice.R
CaCO3 Data
Deuterium Data, (Glaciation III) pre-processed
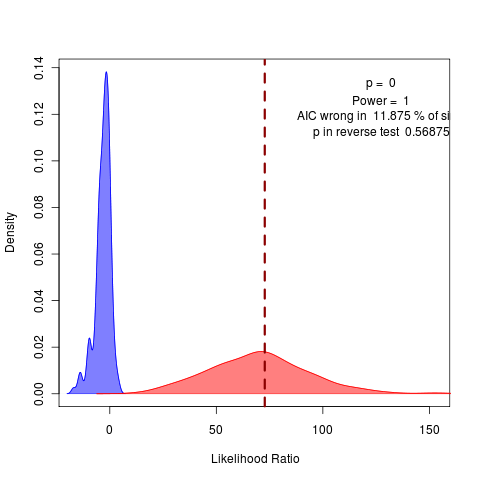
On simulated data we know the correct model. We can confirm that this works, using the LTC simulated dataset from above, we find no reason to prefer LSN, as we did with the real data.
Simulated data
Code updates
- Empirical data files are now read and formatted with own scripts, load_deut.R and load_CaCO3.R Settings for simulated data here, though best to load data-set directly from .Rdat corresponding to figure.