Updated methods for the Monte Carlo estimate of the distributions of likelihood ratios completed on Wednesday this week, modulo some troubleshooting of code. Now exploring the parameter range in which warning signals can be identified with accurate power. Individual power tests provide a good start, but remains to generate power curves for each bifurcation type by magnitude of the loss of stability, length/duration of the timeseries and the sampling frequency.
So far have only applied to the transcritical bifurcation, and without data simulated from the individual-based model.
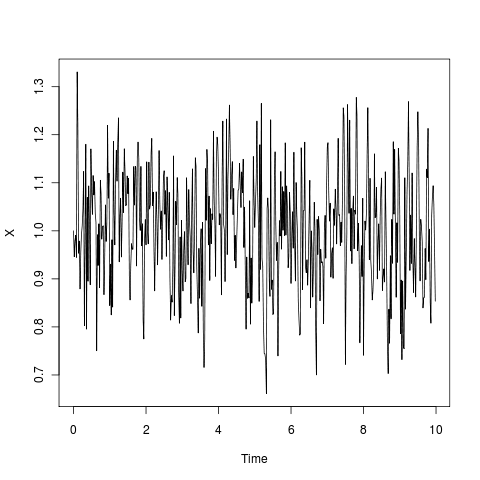
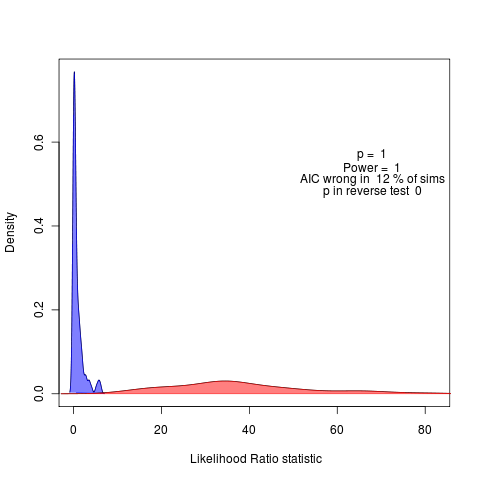
While estimating the actual rate at which stability is being lost seems like it may be rather uncertain exercise, it appears that the method has rather adequate power to detect a loss of stability in cases where it may not be immediately apparent by visual inspection of the data:
Here the parameter r changes from 50 to 41 over t=(0,10), N=500 and the weakening stability is clearly detected:
(code)
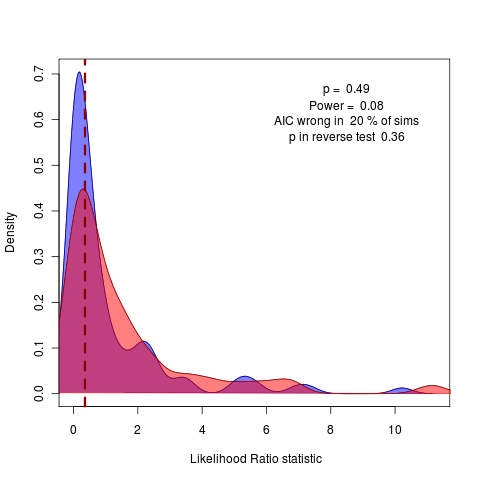
While very weak warning signals face intrinsic limitations to detection with finite data. Here r changes from 1 to .9 over t=(0,1), N=500:
(code)
Of course comparison needs a reduction of dimensionality, as r and T=max(t) both reflect timescales.
Coming up:
Saddle Node Bifurcation example
Power Curves for N, range of R (mT)