- There are several ways we can frame the bootstrapping question. What is the probability that we see a given likelihood ratio statistic (that the log likelihoods differ by a certain spread) just by chance? We have two versions of chance – the chance we see this ratio when model a is correct and the chance we see this ratio when model b is correct. We simulate 2000 data sets under each model, generating a distribution of likelihood ratio scores for each data set. These distributions we can plot together with the likelihood ratio score observed for the real data:
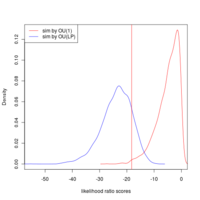


- This shows the pattern we have been observing before. If the data is generated by OU(LP), the observed outcome (vertical line) can be quite confidently ascribed to the OU(LP) model (blue curves on the left and right panels are signficantly higher at this point). The best-fit OU and BM models are quite similar to eachother (center panel) in likelihood ratio scores they assign to all parameters, making it quite impossible to distinguish.
- This style of comparison closes the explanation quite convincingly in favor of OU(LP). While if we assume that BM or OU(1) were the correct models (unlikely as the observed likelihood ratio comes from the tails of those distributions, red line hits red curve; left and right panels) then the false positive rate would be quite higher.
- It remains to see how this depends on different values of possible data – particularly for what data the OU(1) and BM models (center) can be reliably teased apart under this tree.