- oikos post
- launch case of increased sampling on sim data for autocorrelation
- (is our approach more robust to model differences?)
IBM data Example
Using data from the individual-based model simulation of a system approaching a saddle-node.
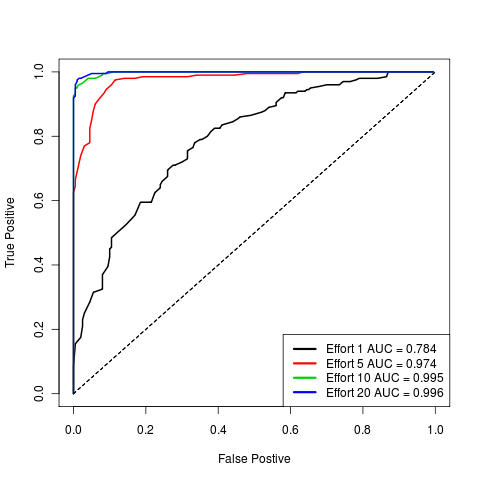
Variance
While the initial example with variance shows almost no signal, increasing the sampling effort substantially improves the performance. This can be seen in the ROC curves and as a tightening and spreading out of the null and test distributions as the sampling effort is increased.
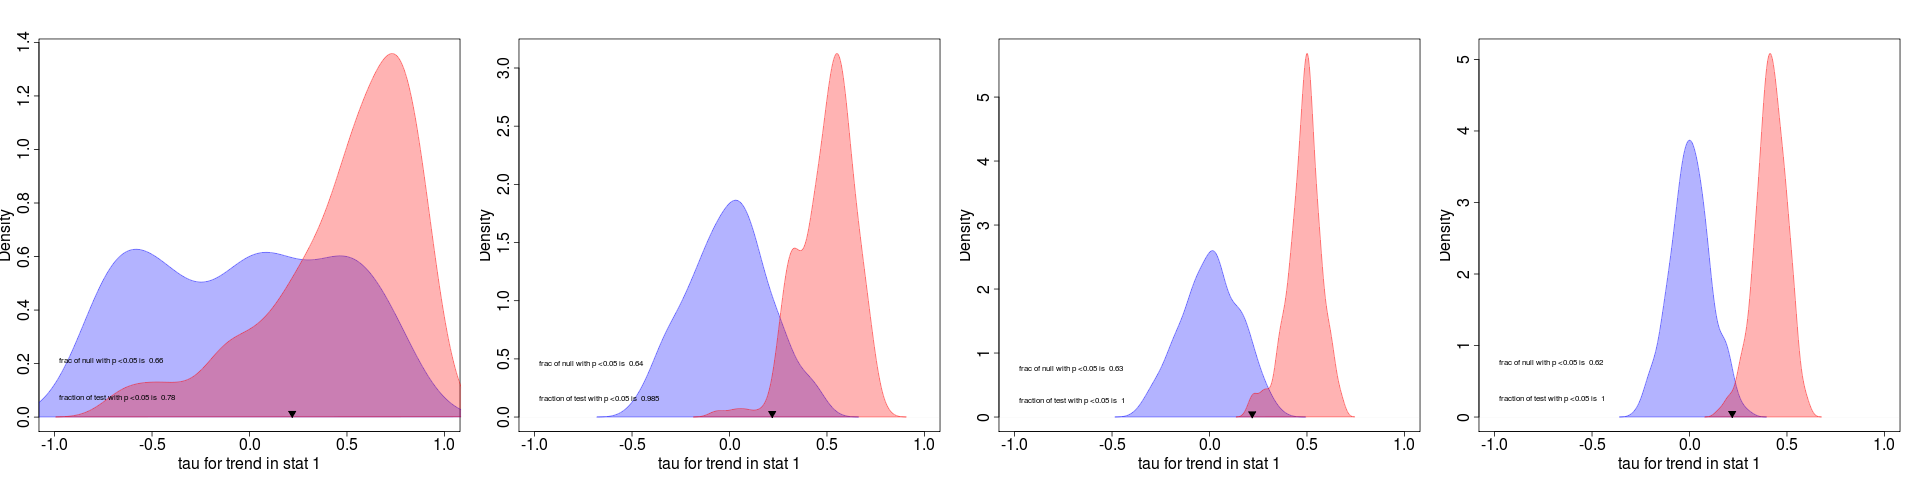
The distributions corresponding to each of the ROC curves above, in order of increasing sampling effort. The original simulation had 40 data points. The coefficient of variation essentially matches the variance pattern.
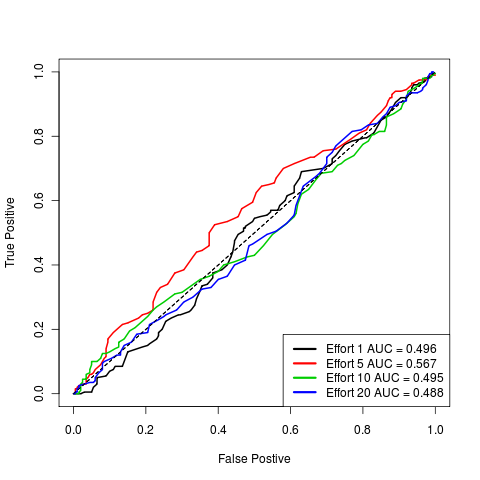
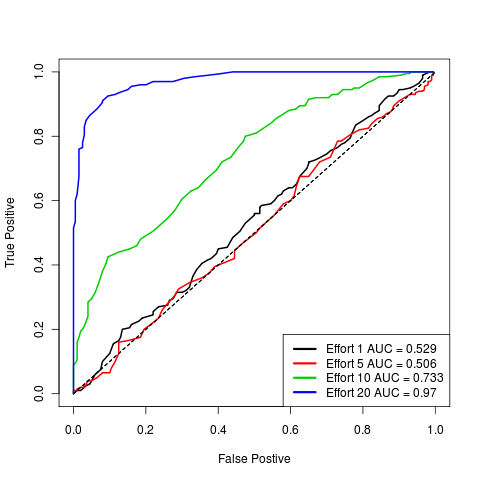
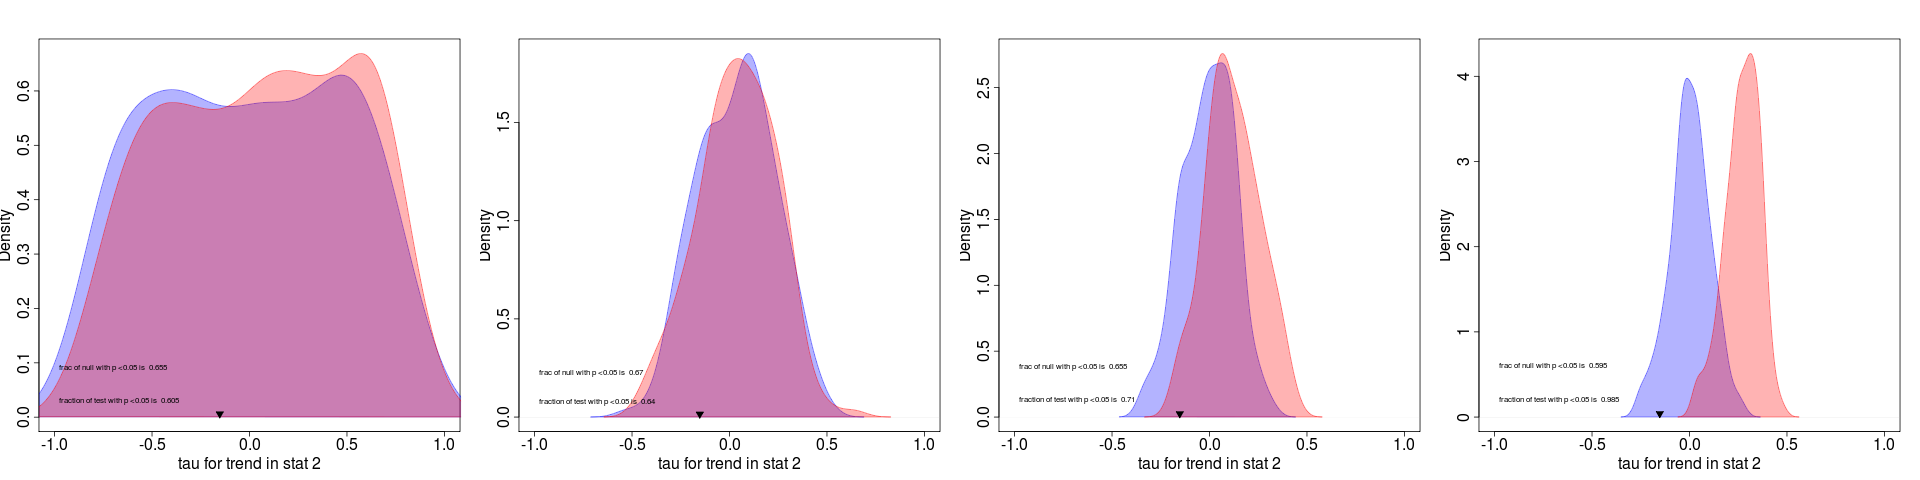
autocorrelation
Autocorrelation requires substantially higher sampling before it becomes very effective at discriminating between the critical and stable cases.
Skew
Skew does not appear to be a useful indicator. This is probably a consequence of the low-order models on which the inference is actually based, since accurately estimating a higher-order model in the first place would be problematic.