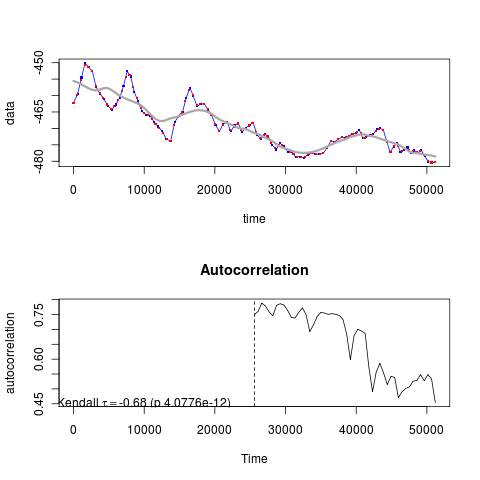
Working on a little data exploration while writing up manuscript. I have been puzzled why it appears that most estimates of tau on the CaCO3 data infer negative correlation, as in
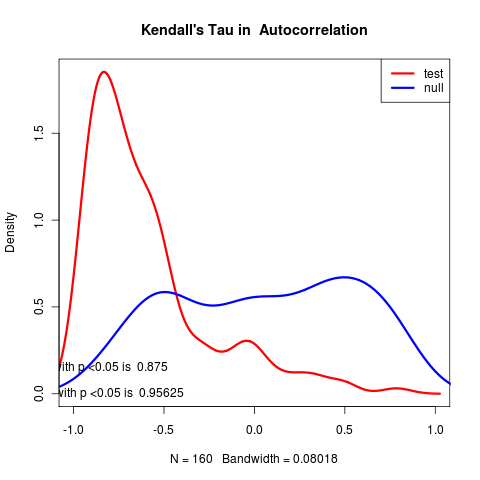
Despite the fact that there seems to be a loss of stability in the model:
require(warningsignals)
load("CaCO3.Rdat")
timedep$pars
          Ro            m        theta        sigma
  8.36841588  -0.03347119  -2.86194248 282.03234042
So m is negative, so that the system is loosing stability, but only very gradually. Collapse occurs at R = 0, and the timeseries covers units of 0 to 5, so
timedep$pars["Ro"] + max(time(X)) timedep$pars["m"]
8.2
Is a decrease from 8.36 to 8.2, not much of a loss.
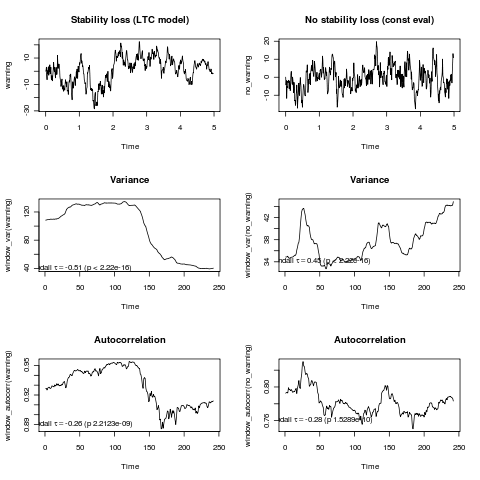
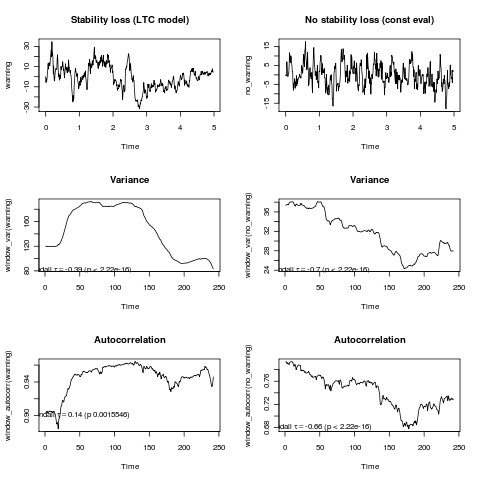
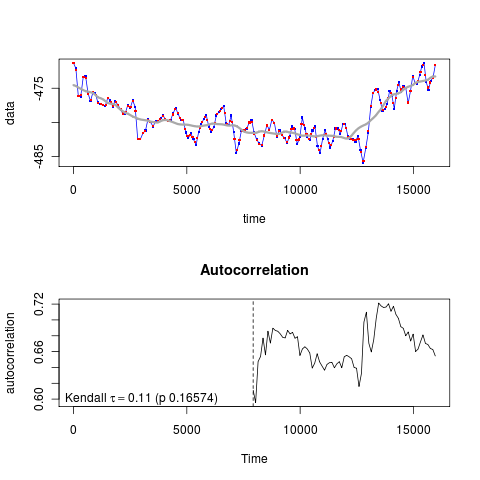
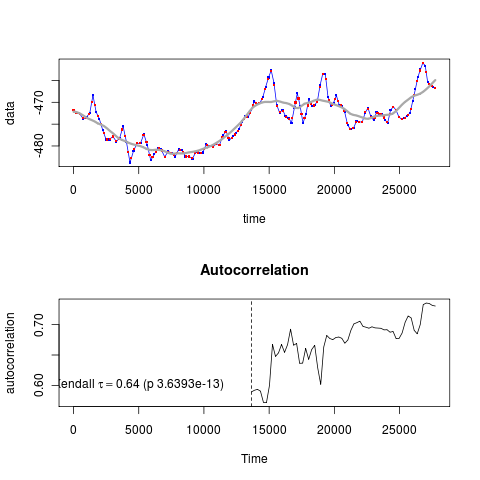
We see simulating under this model that sometimes we get a positive and sometimes a negative correlation; consider two random examples:
Deuterium Data
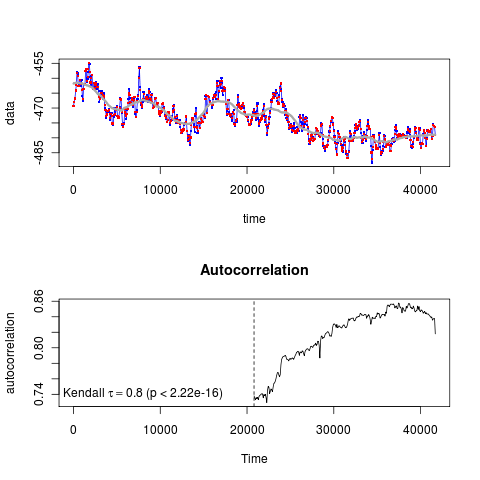
Running the “processed” deuterium data with interpolation and “detrending” to try and match Dakos(Dakos et. al. 2008) results. They don’t report the window average, though I try to guess by rule of thumb: bw.nrd(x) on the timeseries, clearly I do not get the exact detrending, and don’t even recover a positive correlation in two of the datasets:
Glaciation I
Glaciation II
Glaciation III
Glaciation IV
In automating the function which interpolates and detrends, it also guesses the number of points to use in the interpolation as equal to the number in the original dataset, (the original paper tends to add points instead).
References
- Dakos V, Scheffer M, van Nes E, Brovkin V, Petoukhov V and Held H (2008). “Slowing Down as an Early Warning Signal For Abrupt Climate Change.” Proceedings of The National Academy of Sciences, 105. ISSN 0027-8424, https://dx.doi.org/10.1073/pnas.0802430105.