Blomberg’s K distribution under data simulated from BM on the geospiza tree (red) compared to simulating independent random draws from the Normal distribution.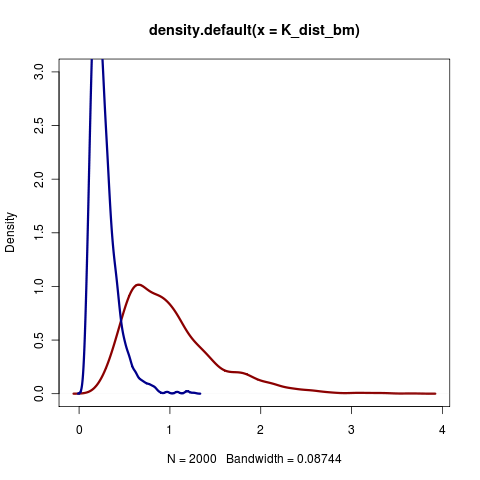
Would be good to compare with differing size trees.
Blomberg’s K distribution under data simulated from BM on the geospiza tree (red) compared to simulating independent random draws from the Normal distribution.
Would be good to compare with differing size trees.