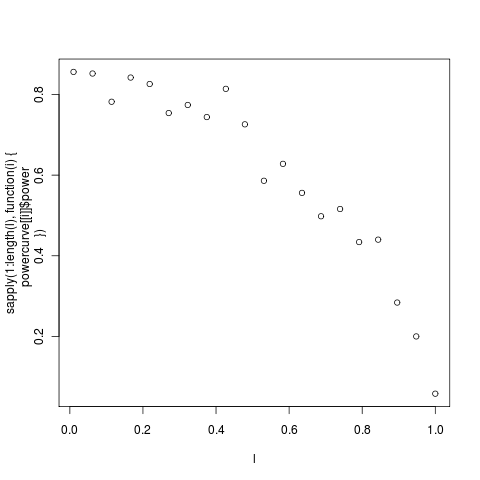
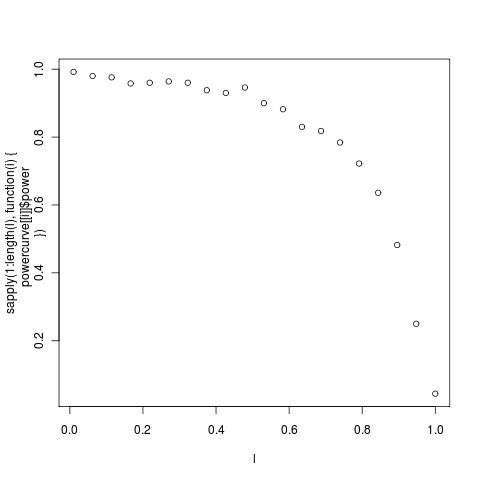
Exploring power in simple tree models. With the smaller tree from the _geospiza _dataset, (14 tips, left) is less than yesterday’s in the bimaculus Anoles (with 23 tips, right)
(code)
Also wrote the OUCH-based wrapper functionto fit tree transformation parameters. Unfortunately it currently transforms from ape to ouch format repeatedly (in order to use ape’s tree transforms, need to write native ouch-format transforms), so it may not be any faster.
Ok, all for tonight, continue from here tomorrow.
Large, Simulated Trees
Interested in comparing these power curves to much larger trees. Note already above that the 14 taxa geospiza tree never gets above a power of 0.80, meaning that even in the most dramatic example of no phylogenetic signal will not be detected 20% of the time. This asymmetric comparison isn’t strictly necessary, we could ask about the power in the reverse test.
The larger simulated trees are much slower, machine chugging away at them now. Really needs a more thorough optimization or ouch port for tree transforms._** ****Two**__** days later..**_ The power curve on the much larger trees completed (on zero). Has basically perfect power (at 95% confidence) any lambda up to 0.95:
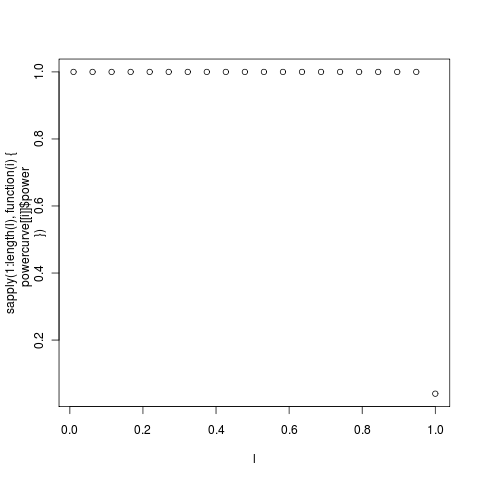
Complete distributions for each of the data points shown here:
[flickr-gallery mode=“tag” tags=“largetreepowerlambda” tag_mode=“all”]