Andrew has put together the preliminary API for the openfisheries.org project. I’ve begun an R package, rfisheries, to interface to the openfisheries project. It would be great to incorporate data from the RAM Legacy database and the seaaroundus.org project, which may be done at the level of the R package or (perhaps more flexibly) directly through the developing openfisheries API.
Here’s a quick proof-of-principle example for Andrew’s API:
(Code linked from image as usual).
ggplot2
Looking into switching my graphics into ggplot.
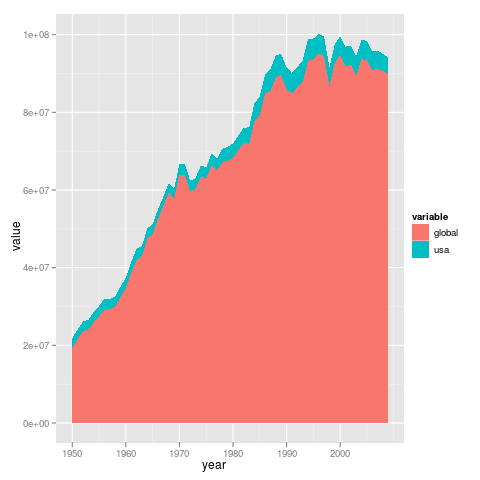
For instance, above graph is made by:
dat <- data.frame(year = global$year, global = as.numeric(global$data),
usa=as.numeric(usa$data))
dat2 <- melt(dat, id="year")
ggplot(dat2, aes(year, value, fill=variable)) + geom_area()
Note that data has to be in “long” form, accomplished by “melt” function.
Primary disadvantages are (a) me having to learn a new syntax (b) users of my package having to learn a new syntax. (a) is something I can get over, (b) is something I can largely avoid by keeping plotting routines and data routines separate enough, though it’s more a problem in building on other’s plotting routines or having other developers extend mine. (I’m sure Hadley would argue that it would in fact be easier, not harder, thanks to the grammar, so there’s that side too). Anyway, non-trivial step when you realize you ’re starting off unable to even create a plot.
Collating references as a starting point. Probably nothing better than the deep end: reading throught ggplot2 book, since getting a handle on the philosophy of the grammar of graphics seems ultimately more useful than getting examples that run.
Continued notes
still writing today’s notes… check back