Finished revisions yesterday after rewriting introduction considerably. Following Graham’s comment, taking a closer look at aic error along power curves:
> load("../../pmc/demos/5594495254.Rdat")
> require(pmc)
> aic <- 2
> aic_errors_size <- sapply(1:(length(n)), function(i) sum(size[[i]]$null_dist > aic)/size[[i]]$nboot )
> aic_errors_shape <- sapply(1:length(lambda), function(i) sum(shape[[i]]$null_dist > aic)/shape[[i]]$nboot )
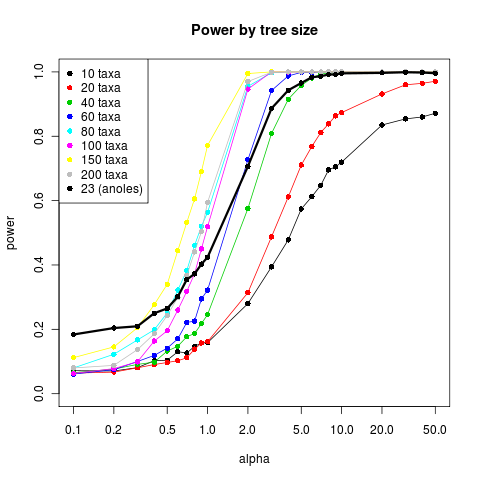
> data.frame(n, aic_errors_size)
n aic_errors_size
1 10 0.1945
2 20 0.2405
3 40 0.1800
4 60 0.1590
5 80 0.0750
6 100 0.1015
7 150 0.0535
8 200 0.1020
> data.frame(lambda, aic_errors_shape)
lambda aic_errors_shape
1 0.01 0.0000
2 0.05 0.0000
3 0.10 0.1255
4 0.20 0.2390
5 0.40 0.1950
6 0.60 0.1910
7 0.80 0.1170
8 1.00 0.1910Of course the aic type I error rate at lambda = 0 (star phylogeny) is zero (all likelihood differences should be zero for this case since the OU model is non-identifiable (can’t disentangle alpha and sigma) but equivalent to the BM model (traits are independent and normally distributed).
Power curves of size and shape
Ran power curves with more examples yesterday, results here.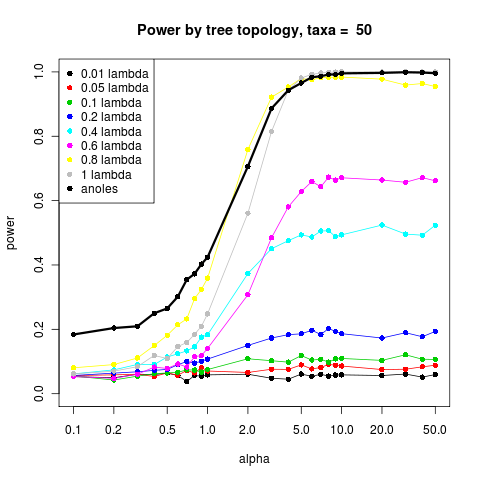
Still to do / waiting on
Sent revisions to Brian and Yaniv for some final comments.
R package needs documentation
Consider figure revisions: Fig 4: use triangle instead of line, replace legend with title bar? consider common x and y axes for all of Fig 4? Revise figure captions.