Blomberg’s K estimates on trees of different sizes. Estimates differ across the distribution of possible data generated by BM model and generated from white noise. In principle, the K statistic should be able to distinguish between data simulated between these two. Of course, the ability to do this depends on the size and structure of the phylogenetic tree – Blomberg’s K is not an estimate of whether the phylogeny is sufficiently structured as to be informative.
Small trees can be unreliable, but larger trees quickly gain substantial separation between the K estimated under the BM vs white-noise simulations.
The distribution of K statistic under Brownian and white-noise models for a yule-process phylogeny of 20 taxa. 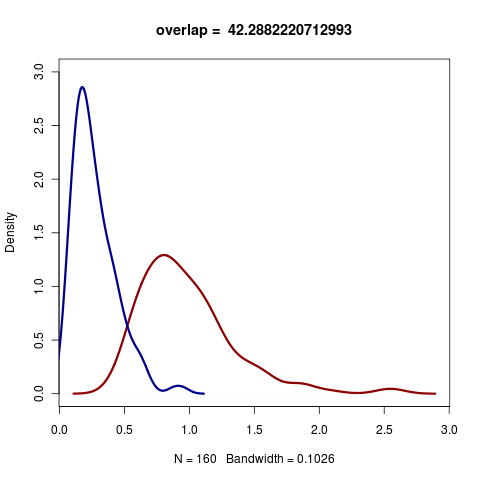
Simulated yule trees of increasing size and the power to distinguish between distributions of kappa expected under BM and WN models. Each point is the power at 95% confidence computed from plots like the first one (see Flickr collection for more). 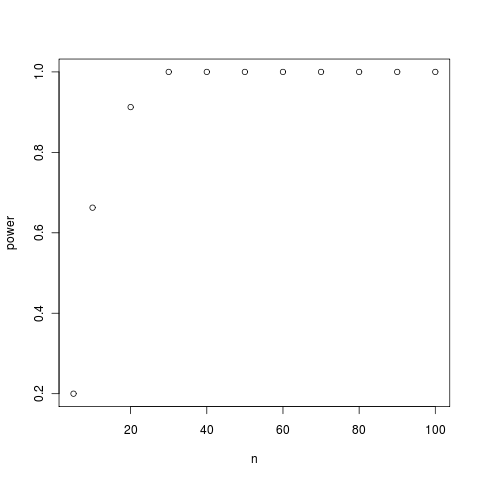
(code)
Birth-death trees are very twiggy and pretty informative, early-bursting style trees are not. Estimation is harder when tree is stretched a bit (using lambda-transformation) into a less twiggy shape. 
[flickr-gallery mode=“search” tags=“phylogenetics” min_upload_date=“2011-01-31 00:00:00” max_upload_date=“2011-01-31 23:59:59”]
Example shows power in a statistic that is not also a model parameter. Might be interesting to repeat with lambda model either for power between lambda and BM or lambda and OU, but also show how distance between statistic and parameter change. As ABC methods become more prevalent, such analysis between statistic and likelihood become more important.
Other topics
Interesting discussion on r-sig-phylo today about model choice.
Should discuss/demonstrate why release of constraint differs from Brownie (variable diversification rate) model. Started testing Liam’s Brownie.lite code and read.simmap function.