Used a simulated tree of 600 taxa to show that lambda distribution continues to improve with larger taxa. Recall the results with 13 taxa and with 23 taxa:
[flickr size=“small” float=“left”]5370016511 [/flickr]
[flickr size=“small” float=“right”]5370635360 [/flickr]
compare to 281 taxa and then 600 taxa:
[flickr size=“small” float=“left”]5310150538 [/flickr]
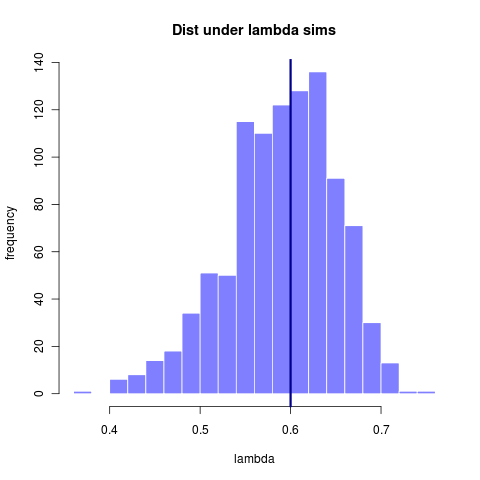
By 281 taxa the distribution is at least centered on the true value. The width of that distribution gets somewhat tighter with more taxa, though the increase is marginal. Note however that for 600 taxa the model choice problem becomes substantially clearer (compare to 23 taxa)
[flickr size=“small” float=“left”]5370635644 [/flickr]
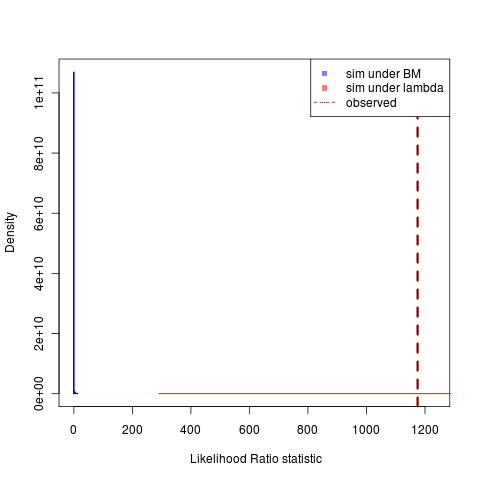
Simulations under the lambda model continue to produce a much larger variance in possible likelihoods, creating this very awkward-looking plots with a distribution that is “all-fat” and one that is “all lean,” but the decreasing region of overlap is very clear. ((Clicking on figures gives the git ids to grab the code. Compare togithub repository or just do “git clone git://github.com/cboettig/Comparative-Phylogenetics.git” “git checkout
Overall these distributions suggest that for simulations under tree-transform models, some data-sets will manage to look very non-Brownian and be easy to identify, but it will always be hard to be that the ones that look very Brownian weren’t produced by lambda. I believe the point to be largely mute as lambda isn’t really a biological model to begin with (what on earth could be responsible for transforming only the branch lengths that don’t correspond to tip taxa??) If you want a model in which the data can become statistically independent of the phylogeny, OU makes a lot more biological sense…
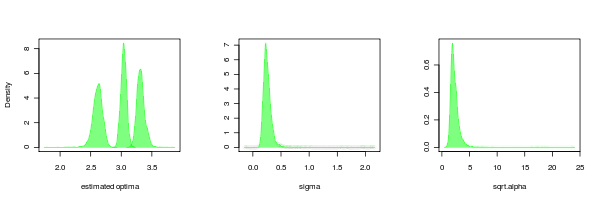
Parameter comparisons
PMC can return the distributions of the parameters as well, just as is done for the lambda parameter in the example above. Doing this for the OU.3 model confirms that while the OU models seem to fit more reliably than the lambda models, their is still much more uncertainty in the tree scaling parameter (alpha) than the other parameters.
It is also interesting to compare to the case where the data is simulated by BM but estimated from OU.3:
large <- density(bm_v_ouLP$null_sim_test_pars[2,])
med <- density(bm_v_ouLP$null_sim_test_pars[3,])
small <- density(bm_v_ouLP$null_sim_test_pars[4,])
sigma_post <- density(bm_v_ouLP$null_sim_test_pars[1,])
alpha_post <- density((bm_v_ouLP$null_sim_test_pars[5,]))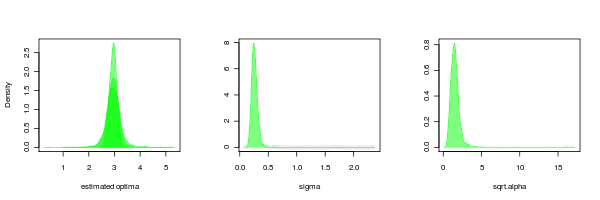
Power curve comparisons
Rerunning the power-curve examples to use simulated data instead of my original example with arbitrary real trees. Also running examples to show the impact of tree topology on power to detect alpha. Using lambda as a convenient way to distort tree topology. Examples running now, see code.
Writing continues
Otherwise I’m continuing to work on the manuscript writing for most of the past few days, hope to have a draft out to Graham and Peter tonight.