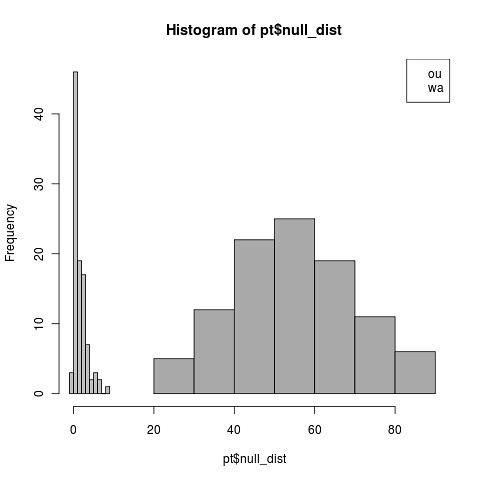
Testing power code. currently null and test distributions of likelihood scores are distinguishable even for small beta on the long time scale. See code for run.
running on shorter timescale. Note that parameters match but small code differences in repository code on the last commit since I committed the version on the local machine (my laptop, for development) but ran a slightly tweaked code (typo in reps vs nboot, .o1), on the production server.
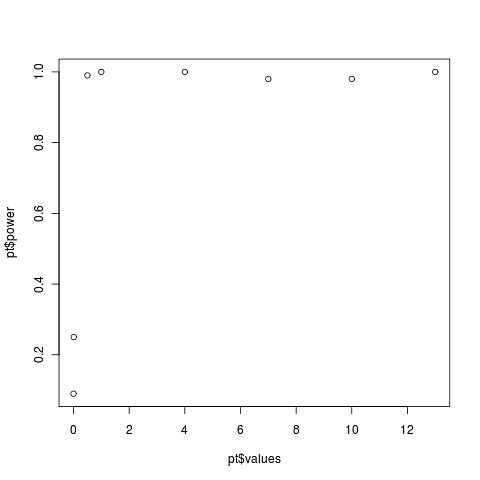
Same string of values, shorter timescale. First four values of beta are .001, .01, .5, 1, for a length of time T=50. Will have to quantify detection of the rate of change vs magnitude of change, and also evaluate power analyses of change point.