- Adding demos directory for the simulations to create the figures in User:Carl Boettiger/Notebook/Comparative Phylogenetics/2010/05/03 and User:Carl Boettiger/Notebook/Comparative Phylogenetics/2010/05/04
- Updating the contour plot figure as per suggestions by Rupert and Ulf:
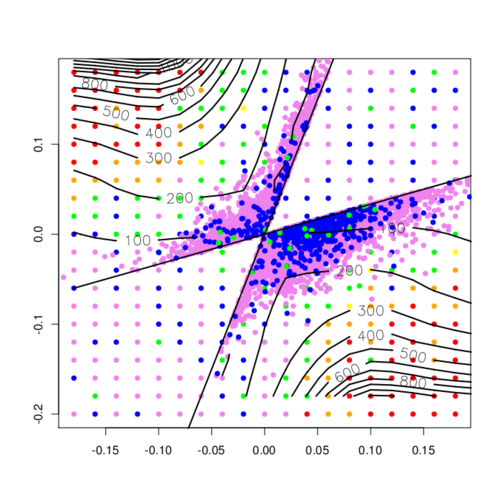

Branching times, original figure
- use more points for the simulation, and don’t put them on a regular grid, but maybe draw them from a uniform distribution, so as not to create spurious impressions of symmetry. You could then maybe also use the tripack package to draw colored Voronoi cells instead of same-sized symbols.
- color cells as grayscales from white (short) to dark (long survival) because the colors probably falsely suggest discrete jumps where there are probably none. Also, a legend that relates the colors to the numbers on the contour lines would be helpful for the viewer.
- make the contour lines (from analytics) more smooth, presumably by choosing more supporting points.
- choose axes to cover the same range and make plot quadratic, so that symmetries are easily revealed.
& more questions:
- Calculate the expected survival time, if we just assume that the dimorphic population moves away from the branching point on a trajectory given by the canonical equation, given a (demographically equilibrated) starting point at (or near) the branching point?
- How does this picture now change (if it does?) when the total number of individuals is in- or decreased and the relative magnitude of demographic fluctuations thus changed?
Some notebook commentary
Unfortunately I once again regret that I did not have a lab notebook last summer while doing most of this research. At least I have the version history, though in svn, and the biweekly reports.