- Manuscript writing.
Phylogenetics
Submitted Lightning talk to iEvoBio
PDG group will be discussing
- Rabosky DL and Lovette IJ. . pmid:18611849. PubMed HubMed [1]
tomorrow, along with critique and response.
- Waiting to hear back from Peter on manuscript.
- Should follow up with Ralph on likelihood ratio discussion with Ethan.
- Transcluding exploratory work on primate phylogeny data:
Embedded:
Primate Phylogeny —————–
Carl Boettiger 00:37, 30 April 2010 (EDT):
- Simon sent me the tree data from their paper:
- Chatterjee HJ, Ho SY, Barnes I, and Groves C. . pmid:19860891. PubMed HubMed [primates]
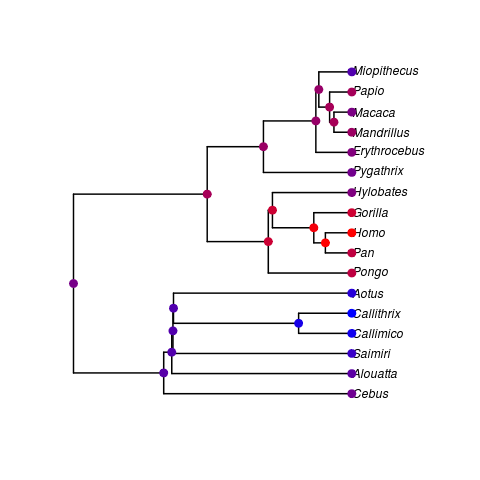
- This is the first calibrated ultrametric tree I’ve been able to couple to the primate data Daniel provided. I’ve preformed a quick ancestral state reconstruction on log brain weight (warmer colors are more massive).
### R code to create figure
library(ape)
library(geiger)
genera_set <- read.nexus("mt.genera.ucld.trees")
nuc_set <- read.nexus("nuc.ucld.trees")
genera <- genera_set[[1]]
nuc <- nuc_set[[1]]
nuc_names <- nuc$tip.label
genera_names <- genera$tip.label
traits <- read.csv("Primate_brain_comparisons.csv")

dups <- duplicated(traits[['Genus']])
trait_names <- as.character(traits$Genus[!dups])
x <- traits$log_brain.weight[!dups]
names(x) <- trait_names


compare <- treedata(nuc, x)
plot(compare$phy)
out <- ace(compare$data, compare$phy)

# a similar function but for the continuous ancestral state
plot_cts_ancestor <- function(phy, data, ancestral){
    plot(phy) # just to get treelength
    treelen <- max(axisPhylo() )
    plot(compare$phy, cex=1, x.lim=1.3*treelen, edge.width=2)
    mycol <- function(x){
    tmp = (x - min(data)) /max(x-min(data))
    rgb(blue = 1-tmp, green=0, red = tmp )
    }
    nodelabels(pch=19, col=mycol(ancestral$ace), cex=1.5  )
    tiplabels(pch=19, col=mycol(data), cex=1.5, adj=0.5) # add tip color code
    }
plot_cts_ancestor(compare$phy, compare$data, out)- This is essentially just at the proof of concept level. A couple obvious steps:
- This uses a single tree from the posterior distribution of trees, which we’ll eventually want to average over in the parameter estimation. Meanwhile should use a consensus MLE tree instead.
- Trees are resolved to genus level, so traits should be genus averages (instead of subsamples).
- Ancestral state reconstruction under the Brownian Motion model is the most preliminary treatment, will certainly be interesting to consider the various multi-peak OU models and identify potential transitions between peaks, as well as power analysis for the model fits.
- Multidimensional trait inference should also be interesting
- Possible bug? The Homo/Pan and Gorilla/Pan nodes would be expected to be in the Gorilla/Pan colour rather than the Homo colour.
Code and data on Github
New github repository for sharing code and data: sandbox
- Grab this repository using git:
git clone git://github.com/cboettig/sandbox.git- Revert to this edit’s version of code and data using git:
git checkout 77af6613db294ca068cfDownload the snapshot as an R package. More information on the downloads page of repository.
- Carl Boettiger 16:17, 5 May 2010 (EDT):
Updated git version using R package is:
git checkout b1a90ad97b90d9cbeaa7
Meetings ——–
Mark Lewis visiting UC Davis:
- Lunch w/ Graduate students, 12-1:30p
- Mark speaking in the Ecology and Evolution Seminar series today at 4pm.
- Dinner w/ Hastings lab, 6:30p
Reading/Misc
- TiddlyWiki option for a lab notebook. Differential Geometry example. Might be a good option for an electronic notebook not intended to be completely open.
- Also Mario has interesting thoughts about a distributed approach combining TiddlyWiki with git.